
The Diagnostic Data Viewer is a free utility built into Windows operating systems, providing users with a centralized location to access and analyze various diagnostic data related to their system’s performance, stability, and overall health. This tool empowers users to understand potential issues, troubleshoot problems, and even contribute to improving the Windows experience through data sharing. This guide explores the features, functionality, and uses of the Diagnostic Data Viewer.
Accessing and Navigating the Diagnostic Data Viewer
The Diagnostic Data Viewer is readily accessible through two primary methods. First, it can be located within the Windows Store, where it can be downloaded and installed like any other application. The second, and often more convenient method, is accessing it through the built-in Diagnostics and Feedback settings menu. This can usually be found through the Settings app (accessible through the Start Menu or by searching for “Settings” in the search bar). Within Settings, navigating to “Privacy & security” and then “Diagnostics & feedback” will reveal the option to open the Diagnostic Data Viewer.
Once opened, the application presents a user-friendly interface organized into logical sections, significantly simplifying the navigation and understanding of potentially complex diagnostic information. These sections typically include:
Event Logs: A Chronological Record of System Events
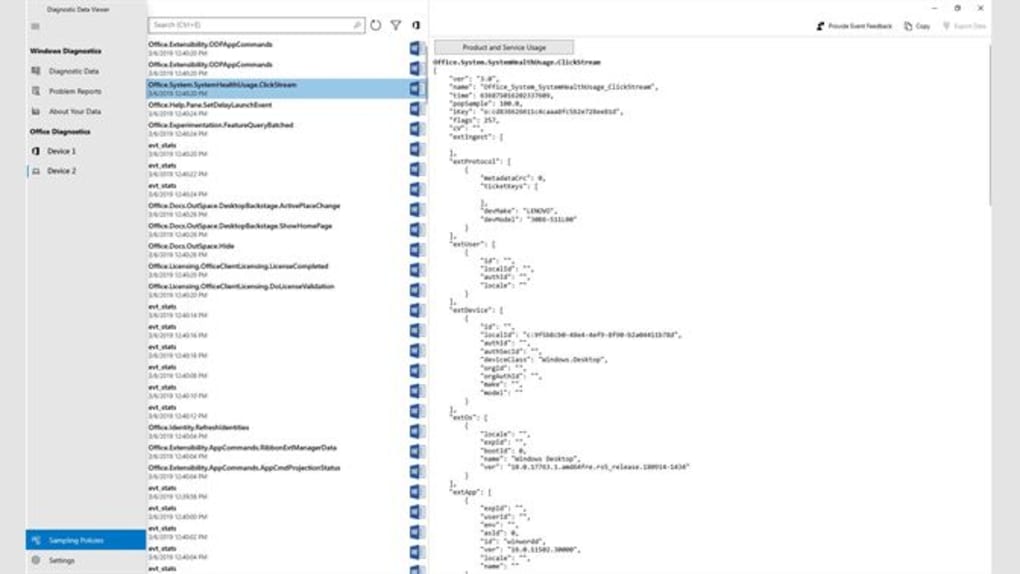
The “Event Logs” section provides a chronological timeline of significant system events. This log includes a variety of information, ranging from routine system operations to error messages and critical system failures. Entries are displayed in reverse chronological order (most recent first), allowing for quick identification of recent events. Each entry includes a timestamp, a brief description of the event, and a severity level (e.g., informational, warning, error, critical).
The power of the Event Logs lies in its detail. Clicking on any individual event entry reveals comprehensive information pertaining to that specific event. This detailed information can often be crucial for diagnosing system issues. For instance, a system crash might generate an error entry with a detailed stack trace, providing valuable clues to developers and advanced users for troubleshooting.
The user interface also includes filtering and sorting capabilities. These allow for refined searches, focusing on specific event types, severity levels, or timeframes. This feature is particularly helpful when dealing with a large volume of data, allowing users to quickly isolate relevant information without being overwhelmed by less critical events.
Troubleshooting: Identifying and Resolving Specific Problems
The “Troubleshooting” section focuses on resolving specific problems users might be encountering. This section is often context-sensitive, meaning the available troubleshooting options might vary depending on reported issues or detected problems. The Diagnostic Data Viewer can analyze error logs and system reports to identify potential issues and suggest specific troubleshooting steps.
This feature can be particularly useful for less technically inclined users, as it can automatically identify problems and propose solutions without requiring in-depth technical knowledge. The steps suggested are generally easy to follow and often lead to a resolution without needing external assistance. However, for more complex problems, the detailed information provided by the Event Logs often becomes necessary for effective troubleshooting.
Logs: Detailed Technical Information
The “Logs” section encompasses a comprehensive collection of system logs, providing even more granular details than the Event Logs section. These logs might include system performance metrics, driver activity, hardware information, and other technical data. This information is crucial for advanced troubleshooting and diagnosing performance issues.
The level of detail within the Logs section may exceed the capabilities of most average users. This is primarily due to the technical nature of the information provided. However, for experienced users and developers, this detailed data provides invaluable insight into the system’s inner workings and can pinpoint the root causes of intricate problems.
Data Analysis and Export Options
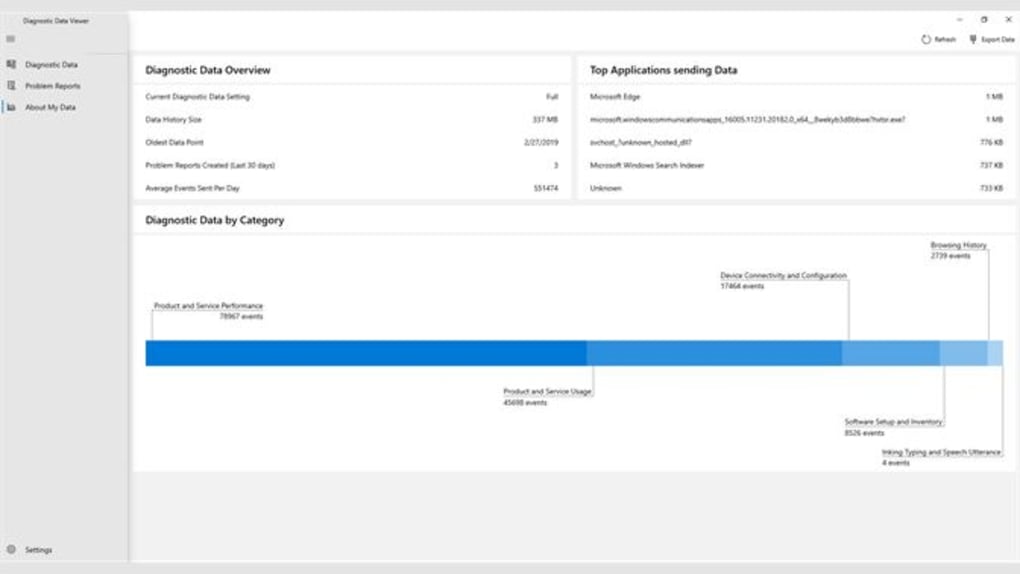
The Diagnostic Data Viewer’s utility extends beyond simple data viewing. Users can analyze the collected data to identify patterns, pinpoint problematic areas, and improve system performance. The ability to filter and sort data is essential in this process. By isolating specific events or metrics, users can analyze specific trends or recurring issues.
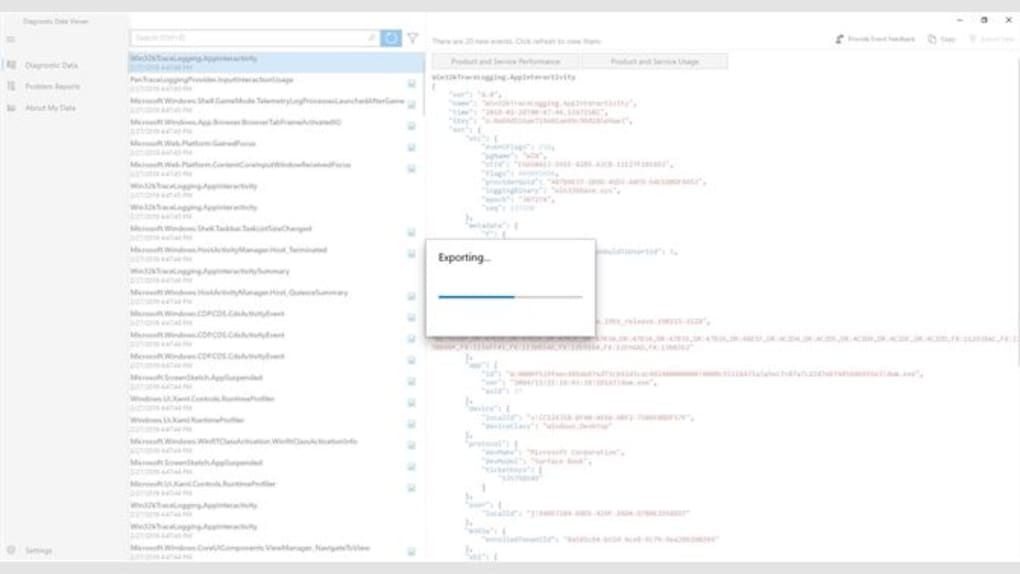
The viewer also provides data export functionality, primarily in the CSV (Comma Separated Values) format. This allows for easy sharing of diagnostic data with technical support teams, developers, or other users. Exporting data is beneficial for creating detailed reports, performing offline analysis, or integrating the data with other analytical tools.
Privacy Considerations and Data Usage
While the Diagnostic Data Viewer collects diagnostic data, Microsoft emphasizes user privacy and data handling transparency. Users have control over the type and amount of data collected. This allows individuals to customize their diagnostic data settings to only send information that they feel comfortable sharing.
Microsoft uses this data to improve the quality, performance, and stability of Windows, making the system more efficient and reliable for all users. Data is anonymized to protect user identity. Furthermore, users can always review their data sharing settings and opt-out of data collection at any time.
Alternatives to the Diagnostic Data Viewer
While the built-in Diagnostic Data Viewer is a robust tool, alternative solutions offer different functionalities or cater to specific user needs. These alternatives include dedicated system monitoring tools, error logging software, and advanced performance analyzers. Choosing an alternative depends on individual requirements and technical expertise. Some of these alternative tools offer enhanced graphical representation of data, more sophisticated analysis capabilities, or specialized features that the Diagnostic Data Viewer might not provide.
Conclusion
The Diagnostic Data Viewer provides a valuable resource for users to understand and manage their Windows system’s health. Its user-friendly interface, powerful filtering options, and data export functionality make it a valuable asset for troubleshooting, performance optimization, and data analysis. While alternative tools exist, the Diagnostic Data Viewer remains a powerful and readily accessible tool for all users, from casual computer users to experienced IT professionals. Its integration within the Windows operating system ensures ease of access and seamless integration with the overall system management experience. By providing users with the tools to understand their system’s health and performance, it empowers users to proactively manage their computing environment.
File Information
- License: “Free”
- Version: “4.2007.11582.0”
- Latest update: “January 24, 2023”
- Platform: “Windows”
- OS: “Windows 11”
- Language: “English”
- Downloads: “605”


