
Equation Grapher is a Windows-based software application designed for plotting and analyzing mathematical functions. Released in 2005, it has garnered significant downloads, establishing itself as a useful tool for students, educators, and anyone requiring a straightforward yet capable function plotter. This review delves into its features, capabilities, and limitations, providing a comprehensive assessment of its strengths and weaknesses.
Core Functionality: Plotting and Analysis
At its heart, Equation Grapher excels at its primary function: visualizing mathematical functions. Users can input a wide range of equations, from simple linear functions like y = 2x to more complex expressions involving trigonometric functions, such as y = sin(x + 10) - cos(x). The software supports the simultaneous plotting of up to twelve graphs, allowing for comparative analysis and the visualization of multiple relationships on a single coordinate plane. This multi-graph capability is a significant advantage, enabling users to explore interactions between different functions and identify key features such as intersections and relative positions.
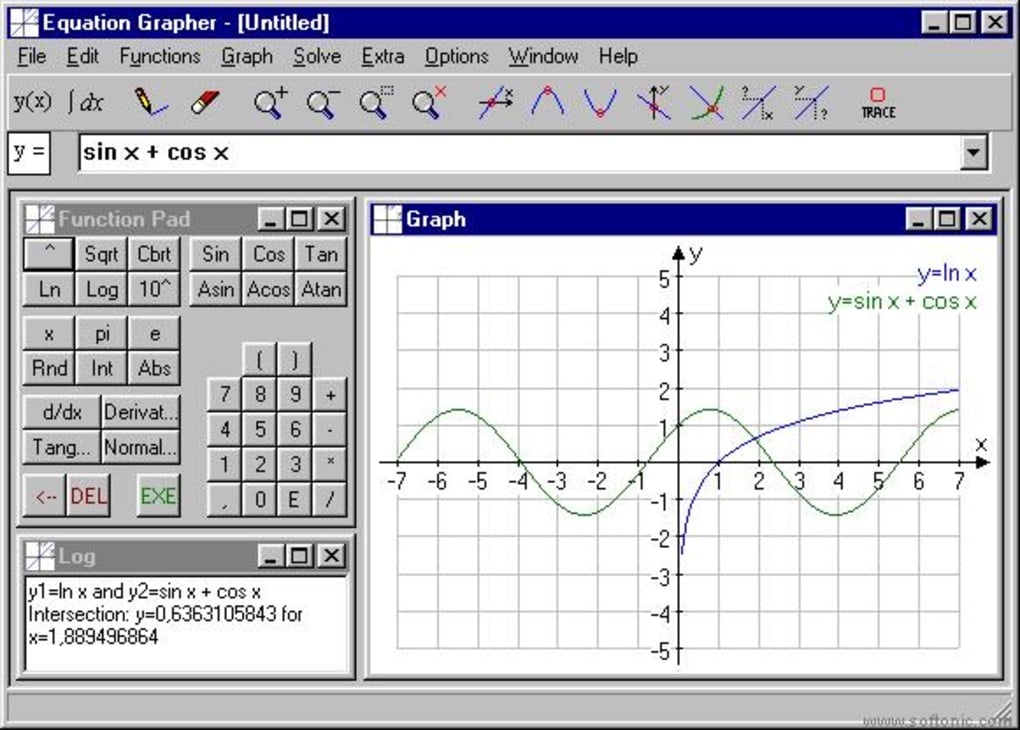
Beyond mere plotting, Equation Grapher provides robust analytical features. Once a function is graphed, the software automatically identifies crucial points, including roots (x-intercepts), maxima and minima (local extrema), and intersection points with other plotted functions. This automated analysis saves users significant time and effort, eliminating the need for manual calculations. The ability to instantly see these critical points significantly aids in understanding the behavior and characteristics of the functions under examination.
Furthermore, Equation Grapher facilitates the calculation and display of integration areas. This is a powerful tool for understanding the concept of integration and its application in various fields, from physics and engineering to economics and finance. The visual representation of the integral adds clarity to a concept that can often be challenging to grasp solely through theoretical explanations.
User Interface and Ease of Use
Equation Grapher boasts a user-friendly interface, prioritizing simplicity and intuitiveness. While not visually striking, the straightforward design allows users to quickly grasp the core functionalities and navigate the program without a steep learning curve. The input fields for function entry are clearly labeled and designed for ease of use, minimizing the chances of errors. The layout of the graphing window is clear and uncluttered, ensuring that the plotted graphs are easily legible and interpretable.
The software also offers convenient zoom functions, allowing users to zoom in on specific areas of interest to examine details more closely or zoom out to get a broader perspective on the function’s behavior over a larger range. The ability to manually adjust the x and y-axis ranges provides further control over the viewing window, enabling users to customize the display to their specific needs. The option to copy the graph and paste it into a word processor or other applications enhances its utility for report writing and presentations.
Limitations and Areas for Improvement
While Equation Grapher offers many valuable features, certain limitations exist. The software’s last update was in 2005, reflecting a lack of recent development and potential compatibility issues with newer operating systems. While it claims compatibility with Windows 95 and earlier versions, functionality on modern systems may not be guaranteed and could be hampered by performance issues or interface quirks. The absence of updates also means it may lack features found in more modern graphing software.
The software’s capabilities are primarily focused on 2D graphing. Users looking to visualize 3D functions or explore more advanced mathematical concepts such as partial derivatives or vector fields will find its functionality limited. A lack of support for parametric equations or polar coordinates also represents a constraint.
The limited number of analytical features is another area for potential improvement. While it efficiently identifies roots, maxima, minima, and intersections, it lacks more advanced analytical tools, such as numerical integration methods or the ability to perform derivative calculations. The absence of these advanced features could limit its usefulness for advanced mathematical analysis.
Comparison with Alternative Software
Compared to modern graphing calculators and sophisticated mathematical software packages, Equation Grapher is a relatively basic application. However, its simplicity and ease of use can be advantageous for users with less technical expertise or those needing a quick and efficient way to visualize and analyze relatively straightforward functions. More advanced software, like Mathematica, Maple, or MATLAB, offer far more comprehensive capabilities but come with a steeper learning curve and higher price tag.
Free alternatives such as Graph or Archim provide similar basic plotting functions, but Equation Grapher’s automated analysis features give it an edge. However, users may prefer the more modern interfaces and enhanced features offered by open-source or commercial alternatives. The choice between Equation Grapher and alternative software ultimately depends on the specific needs and technical expertise of the user.
Conclusion
Equation Grapher provides a user-friendly solution for plotting and analyzing mathematical functions. Its strengths lie in its intuitive interface, automatic analysis features, and multi-graph capabilities. However, its outdated nature, limited analytical tools, and lack of 3D graphing capabilities constrain its utility. While suitable for basic function visualization and analysis, users requiring advanced mathematical modeling or 3D plotting should consider alternative software packages. The decision to use Equation Grapher should be informed by a careful assessment of the specific requirements of the task at hand, weighing its simplicity and ease of use against its limitations. The software remains a viable option for users needing a quick and straightforward tool for visualizing relatively simple mathematical functions, but its age and lack of recent updates must be considered.
File Information
- License: “Trial version”
- Version: “3.232”
- Latest update: “August 19, 2005”
- Platform: “Windows”
- OS: “Windows 98”
- Language: “English”
- Downloads: “13.8K”
- Size: “1.10 MB”


