
Microsoft Process Monitor is a powerful, free system utility that provides real-time monitoring of file system, Registry, and process activity on Windows systems. Far surpassing the capabilities of the standard Windows Task Manager, it offers an incredibly detailed view into the inner workings of your operating system, making it an invaluable tool for system administrators, security professionals, and advanced users seeking to troubleshoot performance issues or identify malicious activity. This comprehensive guide will explore its features, functionalities, and practical applications.
Understanding Process Monitor’s Core Functionality
At its heart, Process Monitor combines the functionalities of two legacy Sysinternals utilities – Filemon and Regmon – into a single, highly enhanced application. Filemon originally monitored file system activity, while Regmon focused on Registry changes. Process Monitor seamlessly integrates these capabilities, adding numerous enhancements to provide a far more comprehensive and user-friendly experience. The result is a real-time, detailed log of every file system access, Registry modification, and process event occurring on the system.
This detailed logging capability is the foundation of Process Monitor’s power. It meticulously records not just what actions are taking place, but also crucial contextual information such as:
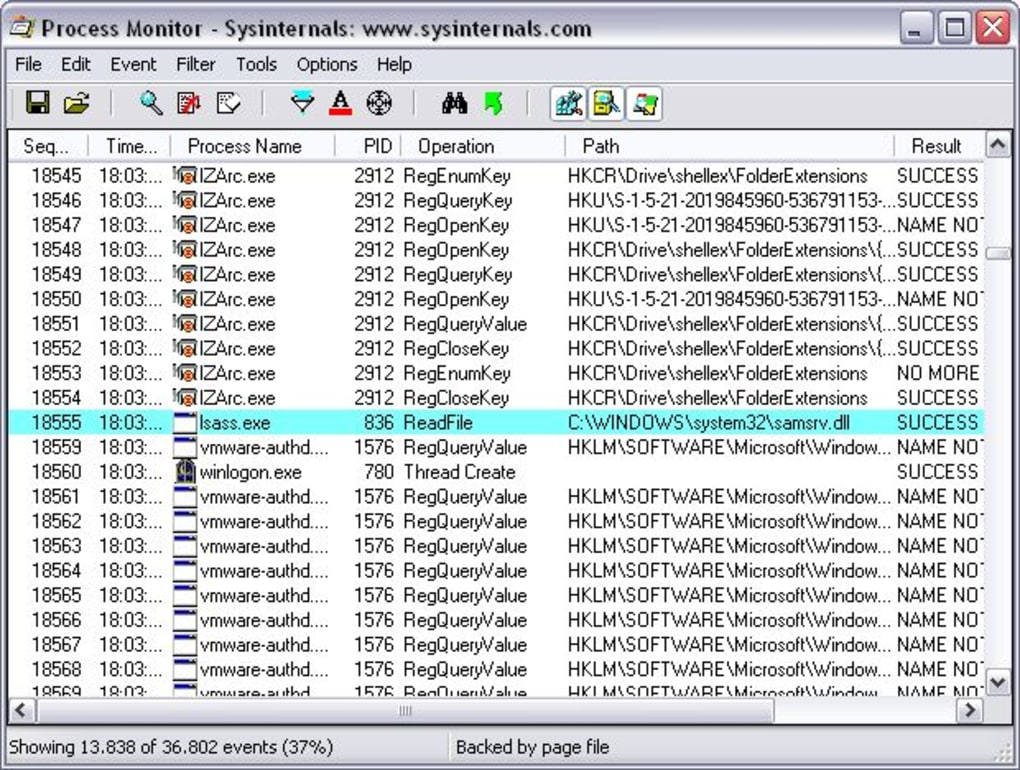
- Process Name and ID: Identifies the specific process responsible for each action.
- Thread ID: Pinpoints the individual thread within a process carrying out the action.
- Operation Type: Specifies the type of operation (e.g., file creation, file deletion, Registry key read, Registry value write).
- Path and Object Name: Provides the full path to the file or Registry key involved.
- Result: Indicates whether the operation was successful or resulted in an error.
- Duration: Shows the time taken to complete the operation.
- Session ID and User Name: Associates the activity with a specific user session.
- Full Thread Stacks: For deeper analysis, the tool provides complete thread stacks, which are crucial for tracing the execution flow leading to the observed activity. The integration of symbol support further enhances the clarity of these stacks, enabling the identification of specific functions and modules involved.
This wealth of information, presented in a readily accessible format, allows users to quickly identify the root cause of various system issues, investigate security breaches, and gain a deep understanding of application behavior.
Utilizing Process Monitor’s Advanced Filtering and Search Capabilities
The sheer volume of data generated by Process Monitor can be overwhelming for novice users. However, the application incorporates sophisticated filtering and search functionalities designed to manage this data effectively. These features are critical for navigating the log and focusing on relevant events.
Filtering: Process Monitor provides a powerful filtering system that allows users to selectively display events based on various criteria. Filters can be applied to virtually every aspect of the event data, including:
- Process Name: Filter events by the name of the process involved.
- Path: Filter events based on file paths or Registry keys.
- Operation: Filter by the type of operation (e.g., create, read, write, delete).
- Result: Filter for successful or failed operations.
- Process ID (PID): Filter by the specific process ID.
- Thread ID (TID): Filter by the thread ID.
- User Name: Filter events based on the user account.
- Time Range: Filter events based on a specific time interval.
The filter syntax is flexible and allows for the creation of complex combinations of criteria, enabling precise targeting of specific events. Filters can be saved for later reuse, increasing efficiency.
Search: Beyond filtering, Process Monitor also offers a robust search function. Users can search the event log for specific strings or patterns within any of the event properties. This is invaluable when looking for specific files, Registry keys, or process names within a massive log file.
These combined filtering and search capabilities allow users to sift through potentially enormous datasets, isolating events of interest and significantly simplifying the analysis process.
Interpreting Process Monitor Results and Troubleshooting System Issues
Interpreting the data generated by Process Monitor requires a certain level of technical understanding. However, the wealth of contextual information provided simplifies the process considerably. By examining the recorded events, users can pinpoint the source of various system problems:
- Performance Bottlenecks: Identifying processes constantly accessing the disk or network can highlight performance bottlenecks.
- Application Conflicts: Observing conflicts between applications competing for resources can assist in resolving conflicts.
- Malware Detection: Suspicious file access patterns or Registry modifications can point to malicious activity.
- Driver Issues: Identifying errors related to specific drivers can facilitate the diagnosis and resolution of driver-related problems.
- Startup Issues: Analyzing the events occurring during the system boot process can pinpoint the source of boot-related problems.
The ability to view complete thread stacks significantly aids in determining the exact call chain that leads to a specific event, making it simpler to trace the origin of errors and pinpoint problematic code sections within applications or drivers.
Analyzing the “Result” column is crucial. A failed operation often indicates an issue – whether it’s a permission problem, a missing file, a corrupted Registry key, or a driver malfunction. By investigating the related details, a user can efficiently diagnose and resolve the underlying problem.
Advanced Features and Applications of Process Monitor
Beyond its core functionality, Process Monitor includes several advanced features that enhance its capabilities:
-
Logging to a File: The ability to log events to a file is essential for analyzing activity over extended periods. This log file can be examined later, even after the Process Monitor application is closed. This allows for detailed offline analysis and retrospective investigations.
-
Boot Logging: Process Monitor can be configured to log events from the system boot process, which allows for detailed examination of the initial stages of system initialization. This is crucial for diagnosing issues related to startup applications, services, or drivers.
-
Process Tree View: The application presents a visual representation of the process tree, illustrating the parent-child relationships between processes. This helps in understanding how processes are related and how they might affect each other.
-
Process Details: For each process, Process Monitor provides access to comprehensive details, such as command-line parameters, memory usage, and handles. This information can be invaluable when troubleshooting complex issues involving multiple processes.
-
Symbol Support: The integration of symbol support for thread stacks significantly enhances the clarity of the stack traces. This enables users to identify the specific function and module causing an issue.
Conclusion: A Powerful Tool for System Professionals and Advanced Users
Microsoft Process Monitor is a powerful and versatile tool, particularly beneficial for system administrators, security analysts, and advanced users dealing with complex system issues. While its extensive detail might initially seem daunting, the combination of real-time monitoring, comprehensive filtering, and powerful search functions makes it an indispensable resource for anyone needing an in-depth understanding of their Windows system’s behavior. Its ability to pinpoint the root cause of various problems, from performance bottlenecks to security threats, makes it a must-have utility for those seeking complete control and visibility over their operating system. While requiring a certain level of technical proficiency, the rewards of mastering Process Monitor are substantial in terms of troubleshooting efficiency and system understanding.
File Information
- License: “Free”
- Latest update: “January 20, 2024”
- Platform: “Windows”
- OS: “Windows 8”
- Language: “English”
- Downloads: “12.7K”
- Size: “3.46 MB”


