
In the vast and ever-evolving landscape of personal computing, certain software utilities carve out a niche, becoming indispensable tools for enthusiasts, system administrators, and even casual users seeking deeper insight into their machine’s inner workings. Among these foundational applications stands MotherBoard Monitor (MBM), a name that resonates with many who navigated the complexities of PC hardware in the late 1990s and early 2000s. Far more than a simple diagnostic, MBM emerged as a robust, free software utility designed for Windows, specializing in comprehensive system monitoring. It provided users with unprecedented access to critical data points, ranging from the mundane yet vital fan speeds to the intricate details of component temperatures and voltages. This powerful tool empowered users to not only observe their system’s health in real-time but also to proactively safeguard it against potential issues through its intelligent alarm features. This article delves into the history, functionality, impact, and enduring legacy of MotherBoard Monitor, examining how it shaped the expectations for system monitoring software and why its principles remain relevant in today’s sophisticated computing environments. We will explore its core capabilities, advanced features, its place within the historical context of computing, and its continued relevance for those interested in the fundamental aspects of PC performance and stability, always remembering its availability through platforms like PhanMemFree.
The Dawn of System Monitoring: Understanding MotherBoard Monitor’s Core Functionality
In an era when personal computers were becoming more powerful and complex, the need for robust system monitoring tools grew exponentially. The early days of Windows 95 and NT environments saw an increase in multi-component systems, faster processors, and more demanding applications, all of which placed significant stress on hardware. Understanding the operational parameters of these components became crucial for maintaining stability, optimizing performance, and preventing catastrophic failures. MotherBoard Monitor (MBM) stepped into this void, offering a level of detailed insight that was groundbreaking for its time. Released as a free utility, it quickly garnered a loyal following among a community eager to peek behind the curtain of their beige boxes and truly understand the pulse of their machines.
A Glimpse into the Past: MBM’s Origins and Purpose
MotherBoard Monitor was not just another piece of software; it was a response to a growing demand from the PC enthusiast community for transparency and control. Back in the late 1990s and early 2000s, overclocking was gaining traction, and with it, the risks of overheating and component degradation. Users needed a reliable way to ensure their ambitious clock speed bumps weren’t pushing their hardware to an early grave. MBM provided this crucial feedback. Its purpose was clear: to offer a comprehensive, real-time overview of a motherboard’s vital signs. Prior to MBM, such detailed monitoring often required proprietary software bundled with specific hardware or lacked the granular control and customization options that MBM eventually delivered.
The software was developed by Live Wire Dev, and its emergence filled a significant gap in the market for a universal monitoring solution. It was specifically designed for the Windows operating system, with compatibility extending from Windows 95 through to Windows NT and subsequent versions. This broad compatibility meant that a large segment of the PC user base could benefit from its capabilities. The commitment to making it a free utility, accessible to all, further cemented its status as a community favorite, fostering a culture of hardware awareness and proactive maintenance that was somewhat nascent at the time. Its inclusion in catalogs like PhanMemFree.org ensured its widespread distribution and accessibility, cementing its place as a go-to tool for hardware enthusiasts.
Key Monitoring Capabilities: Temperatures, Voltages, and Fan Speeds
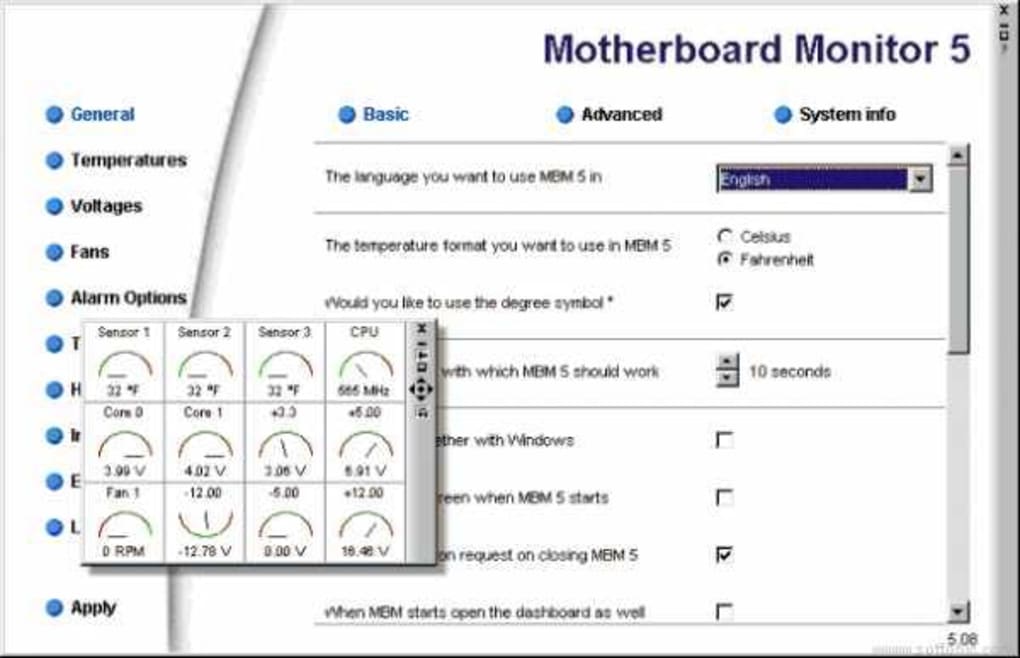
At its heart, MotherBoard Monitor was an exquisite sensor reader, translating raw data from the motherboard’s integrated circuits into understandable, actionable information for the user. Its primary functions revolved around three critical hardware metrics:
-
Temperatures: The internal temperature of a PC’s components is perhaps the most direct indicator of its health and stability. MBM allowed users to monitor various temperature points across the motherboard, including the CPU, GPU (if supported by the motherboard’s sensor array), and sometimes even ambient case temperatures. Elevated temperatures are a direct precursor to system instability, throttling, and permanent hardware damage. By providing real-time temperature readings, MBM empowered users to identify cooling issues, faulty fans, or inadequate thermal paste applications before they led to critical failures. This was especially invaluable for overclockers who pushed their processors beyond stock speeds, making temperature monitoring not just a convenience, but a necessity for successful and stable operation.
-
Voltages: The electrical current supplied to various components is equally vital. Fluctuations or incorrect voltage levels can severely impact system stability and component longevity. MBM provided readings for core voltages supplied to the CPU, memory, and other critical parts of the motherboard. For instance, a CPU requiring 1.5V might receive only 1.4V under load, leading to crashes, or conversely, an excessive voltage could prematurely degrade the chip. MBM’s ability to display these values allowed users to verify that their power supply unit (PSU) was delivering stable power and that motherboard voltage regulators were operating within specifications. This insight was particularly useful for diagnosing subtle system instabilities that might not manifest as clear overheating issues.
-
Fan Speeds: Cooling fans are the workhorses of a PC’s thermal management system. MBM could read and display the RPMs (revolutions per minute) of connected case fans, CPU coolers, and even some GPU fans. A fan operating below its expected RPM could indicate a failing motor, an obstruction, or an issue with its power supply, directly leading to increased component temperatures. Conversely, a fan spinning excessively fast might point to an inefficient cooling solution or an overly aggressive fan curve. By monitoring fan speeds, users could ensure their cooling infrastructure was functioning optimally, identifying and replacing failing fans before they compromised system health. This feature was also crucial for users striving for a balance between cooling performance and acoustic levels.
These core monitoring capabilities, delivered in a unified interface, transformed how users interacted with and understood their PCs. It moved beyond the abstract concept of “system stability” to a tangible, data-driven assessment, all thanks to the detailed insights provided by MotherBoard Monitor.
Beyond Basic Metrics: Chip and Memory Information
While temperatures, voltages, and fan speeds formed the bedrock of MBM’s utility, the software extended its diagnostic reach to provide even more granular details about the system’s hardware configuration. MBM was capable of retrieving and displaying detailed system information concerning the integrated chips on the motherboard and the installed memory modules. This feature was particularly useful for enthusiasts, system builders, and troubleshooters alike, offering a single point of reference for critical hardware specifications.
For the “chip” information, MBM could often identify the specific Southbridge or Northbridge chipsets, which control various motherboard functions like I/O, PCI Express lanes, and memory communication. Understanding which chipset was in use was vital for driver compatibility, identifying potential hardware limitations, and determining upgrade paths. For instance, knowing the exact revision of a chipset could help users ascertain if their motherboard supported newer processor technologies or faster RAM speeds. This level of detail went beyond what basic operating system utilities might provide, offering a more complete picture of the motherboard’s underlying architecture.
Regarding “memory” information, MBM could often report on the type, speed, and sometimes even the manufacturer of the installed RAM modules. While dedicated memory utilities exist, having this information integrated into a comprehensive monitoring suite was a significant convenience. This allowed users to quickly verify if their memory was running at its advertised speed, check for mismatched modules, or ensure that their BIOS settings were correctly configured for optimal memory performance. For those planning memory upgrades, MBM’s ability to display current memory configurations helped in selecting compatible and efficient new modules.
In essence, MBM acted as a mini-hardware inventory tool in addition to its real-time monitoring functions. This dual capability made it an invaluable resource for anyone looking to understand, troubleshoot, or optimize their PC at a deep hardware level. It empowered users by providing them with the knowledge necessary to make informed decisions about their system’s health and future, all within a free and accessible package promoted by platforms like PhanMemFree.
Advanced Features and User Empowerment: Alarms and Customization
MotherBoard Monitor wasn’t just a passive observer of system health; it was an active guardian. Its true power lay not only in its ability to present raw data but also in its sophisticated alarm system and extensive customization options. These advanced features transformed MBM from a mere diagnostic tool into a proactive defense mechanism, empowering users to define their system’s acceptable operational parameters and receive instant alerts when those boundaries were breached. This capability was revolutionary for its time, providing a level of control and peace of mind that was previously unavailable to the average PC user.
Proactive Protection: The MBM Alarm System
The alarm system in MotherBoard Monitor was arguably its most defining advanced feature, setting it apart from many contemporary monitoring utilities. It moved beyond simple data display to offer genuine proactive protection against potential hardware failures. Users could set custom thresholds for any monitored parameter—be it temperature, voltage, or fan speed. If a reading exceeded (or fell below) these user-defined conditions, MBM wouldn’t just flag it; it would initiate an immediate, configurable response. This foresight in design allowed for critical intervention before a minor anomaly escalated into a major system crash or permanent component damage.
The range of alert mechanisms available was surprisingly comprehensive for a free utility of its era:
-
E-mail Alerts: For systems that were monitored remotely or those where immediate visual attention was not guaranteed, MBM could be configured to send an e-mail notification. This was particularly useful for server administrators or users who left their PCs running unattended for long periods. A sudden spike in CPU temperature, for instance, could trigger an e-mail to their inbox, prompting them to check on the system, even if they were away from the computer. This feature leveraged the emerging prevalence of internet connectivity to extend the reach of system monitoring.
-
FTP Transfer: In more specialized scenarios, MBM could initiate an FTP (File Transfer Protocol) transfer. This might involve uploading a log file detailing the conditions that triggered the alarm, or even a screenshot of the system’s status. For advanced users or network environments, this provided a method for historical data collection and forensic analysis of system anomalies, allowing for trends to be observed over time and helping to pinpoint intermittent issues.
-
Pager Message: Reflecting the technology of the early 2000s, MBM even included the ability to send a pager message. While pagers are largely obsolete today, this feature highlights the developers’ commitment to offering immediate and robust notification options in line with the communication technologies available at the time. For critical systems, a pager message offered an instant, intrusive alert that would likely not be missed, demonstrating MBM’s capability to integrate with various personal alert systems.
Beyond these external notifications, MBM could also trigger local alerts such as audible alarms, pop-up messages, or even automatically shut down the system to prevent damage from severe overheating. This multifaceted alarm system transformed MBM from a passive information display into an active system guardian, significantly enhancing its utility for serious PC users.
User-Defined Conditions: Tailoring Monitoring to Your Needs
The effectiveness of MotherBoard Monitor’s alarm system was inherently tied to its highly flexible, user-defined conditions. MBM didn’t impose a “one-size-fits-all” approach; instead, it empowered users to tailor monitoring parameters precisely to their specific hardware, cooling setup, and usage patterns. This customization was crucial because what constituted a safe operating temperature or voltage level could vary significantly between different CPU models, motherboard revisions, and ambient environmental conditions.
Users could set distinct upper and lower thresholds for each monitored value. For example, an enthusiast with a highly overclocked CPU might set their temperature alarm higher than someone running a stock system, as they might have invested in a more robust cooling solution. Conversely, a critical server might have very conservative temperature limits to ensure maximum uptime. Similarly, voltage thresholds could be fine-tuned. A slight drop in a 12V rail might be negligible for some, but a critical red flag for others, indicating an ailing power supply.
The ability to define these conditions with such granularity meant that MBM became a truly personalized monitoring solution. Users could experiment with their hardware, knowing that MBM would act as a safety net, alerting them if their modifications pushed the system beyond comfortable or safe limits. This level of customization fostered a deeper understanding of hardware behavior, as users were actively engaged in defining the boundaries of their system’s performance envelope. It turned monitoring into an interactive process rather than a static display of numbers.
Performance and Resource Footprint: Lightweight Yet Powerful
One of the often-overlooked yet critical aspects of any background utility like MotherBoard Monitor is its own impact on system resources. In the era of Windows 95, 98, and NT, where RAM and CPU cycles were far more precious commodities than they are today, a resource-heavy monitoring tool could paradoxically degrade system performance or even trigger the very instabilities it was designed to detect. MBM, however, distinguished itself as a remarkably lightweight yet powerful application.
Despite its comprehensive feature set, MBM was designed to occupy less storage space and consume minimal system resources compared to many other programs in the “Software utilities” section, as noted in its specifications. This efficient design was a testament to optimized coding and a clear understanding of the target operating environments. Running in the background, MBM could continuously monitor critical hardware parameters without imposing a noticeable overhead on the CPU or hogging valuable RAM.
This low resource footprint was a significant advantage. It meant that even users with older, less powerful machines could benefit from real-time system monitoring without sacrificing performance in their primary applications, whether that was gaming, productivity software, or web browsing. For overclockers and power users, it ensured that MBM itself wasn’t contributing to the heat or instability it was trying to mitigate. The ability to deliver such powerful monitoring capabilities while remaining unobtrusive was a key factor in MBM’s widespread adoption and enduring popularity, making it a truly valuable addition for any Windows user via platforms like PhanMemFree.
MotherBoard Monitor in Context: Legacy, Popularity, and Alternatives
MotherBoard Monitor wasn’t developed in a vacuum. It existed within a vibrant ecosystem of hardware and software, shaped by the technological advancements of its time and contributing to the evolution of PC diagnostics. Its success and widespread adoption speak volumes about its effectiveness and the genuine need it addressed within the computing community. Understanding MBM’s place in this context requires looking at its global reach, its historical impact, and how it stacked up against its contemporaries and successors.
Geographical Reach and Enduring Popularity
According to its historical download data, MotherBoard Monitor achieved significant popularity, with hundreds of thousands of installations globally. As of late 2004, it had accumulated over 413,369 installations since its inclusion in various software catalogs. Even years later, around 2022, it still registered tens of thousands of downloads annually, indicating an enduring interest, likely from users maintaining older systems or those with a keen interest in computing history.
Its popularity wasn’t uniform across the globe but showed particular strength in specific regions. The data highlights its prevalence in countries such as the Russian Federation, Latvia, and the United States. This geographical distribution suggests a strong community of PC enthusiasts and power users in these areas who valued deep system insight and hardware control. In these regions, where PC building and customization were prevalent, MBM became a staple, shared and recommended within local computing communities. The fact that a free, English-only utility could achieve such global traction underscored the universal appeal of reliable hardware monitoring and the power of grassroots adoption fueled by positive user experiences. Its availability through reputable platforms like PhanMemFree.org undoubtedly contributed to its widespread distribution.
The long tail of its download history also points to its robustness and the longevity of its design. Even as operating systems evolved and hardware became more sophisticated, MBM continued to be sought after, a testament to its foundational utility and effectiveness for the systems it was designed to support.
The Evolving Landscape of System Monitoring: MBM’s Place in History
MotherBoard Monitor didn’t just exist; it set a precedent. Before MBM, detailed, real-time hardware monitoring was often rudimentary, relying on simple LED readouts on motherboards, basic BIOS screens, or proprietary software that only worked with specific chipsets. MBM democratized this crucial function, making sophisticated sensor data accessible to a broader audience without proprietary restrictions or cost barriers.
Its impact on the evolving landscape of system monitoring cannot be overstated. MBM demonstrated the critical importance of a unified, customizable interface for displaying temperatures, voltages, and fan speeds. It proved the value of proactive alerts and user-defined thresholds. These features, once pioneering, became expected functionalities in subsequent monitoring software. Modern tools like HWMonitor, SpeedFan, and AIDA64 owe a debt to MBM’s foundational work, as they built upon the principles of comprehensive sensor integration and user empowerment that MBM championed.
MBM’s legacy lies in its role as a trailblazer. It showed developers and hardware manufacturers alike that users desired granular control and transparent insight into their PC’s health. This pushed the industry towards better sensor integration on motherboards and more sophisticated, user-friendly monitoring applications. In essence, MBM helped to mature the field of PC diagnostics, shifting it from a reactive troubleshooting exercise to a proactive maintenance discipline. It taught a generation of PC users the importance of understanding their hardware’s operational limits and how to keep it running optimally, a lesson that remains crucial even with today’s advanced systems.
Comparing MBM to Contemporaries and Modern Solutions
To truly appreciate MotherBoard Monitor, it’s helpful to place it alongside its contemporaries and the modern solutions it influenced. In its prime, MBM stood out for its comprehensive nature and its alarm features, which were not always as robust in other free utilities.
Contemporaries: Tools like SpeedFan (still popular today) also focused on monitoring temperatures, voltages, and fan speeds, and even offered fan control, which MBM didn’t directly emphasize as much. However, MBM was often praised for its detailed motherboard-specific sensor compatibility and its advanced alerting system. HWMonitor (and its derivatives like HWM BlackBox) emerged later or concurrently, offering similar real-time hardware monitoring. MBM distinguished itself through its deep configurability and the range of alert options, including older technologies like pagers, indicating a broader scope for its time. Other tools like Core Temp and Real Temp specialized primarily in CPU temperature monitoring, offering deep insight into that one component, whereas MBM aimed for a broader, holistic view of the motherboard.
Modern Solutions: Today’s system monitoring tools are incredibly sophisticated. Applications like HWMonitor and HWInfo64 provide an exhaustive list of sensors from every conceivable component, including detailed GPU information, SSD health, and extensive network statistics. Software suites like AIDA64 combine monitoring with detailed hardware identification and benchmarking. Operating systems themselves, like Windows, now include more robust built-in performance monitors.
However, MBM’s simplicity and efficiency remain notable. It provided essential data without overwhelming the user, and its lightweight footprint was ideal for the systems it targeted. While modern tools offer more bells and whistles, the core principles of monitoring temperatures, voltages, and fan speeds for system stability and longevity remain paramount. MBM laid the groundwork for these expectations, proving that such a utility could be powerful, free, and accessible, fostering a community of informed PC users. Its enduring availability through archives and sites like PhanMemFree.org means it’s still accessible for those nostalgic for or maintaining older hardware.
Installation, Compatibility, and the Continued Relevance of System Diagnostics
The journey of MotherBoard Monitor from a niche utility to a widely recognized tool speaks volumes about its effectiveness and the fundamental need it addressed. Even as technology has advanced, the core principles that underpinned MBM—real-time insight into hardware health—remain critically important. Understanding its practical aspects, such as installation and compatibility, provides a complete picture of its historical footprint and its lessons for today’s computing environment.
Getting Started with MotherBoard Monitor: Installation and Setup
One of the factors contributing to MotherBoard Monitor’s accessibility and popularity was its relatively straightforward installation process. As a standard Windows utility, it followed the conventional setup procedures prevalent in its time. Users would typically download a small executable file, often from reputable software repositories like PhanMemFree.org, and then run a standard installation wizard.
The setup usually involved accepting a license agreement (being a free software, this was generally permissive), choosing an installation directory, and then allowing the program to install its necessary files. Once installed, MBM would typically launch, often appearing as an icon in the system tray, providing quick access to its main interface.
The initial setup might have required some configuration, especially in detecting the correct motherboard sensors. This was a crucial step, as motherboard designs varied significantly, and MBM needed to identify the specific monitoring chips (like Winbond, ITE, or Analog Devices sensors) present on the user’s board. The program often included a database of known motherboard layouts and sensors, and users could manually configure it if automatic detection failed. This initial calibration was vital for ensuring accurate readings, setting the stage for reliable monitoring. Despite this slight learning curve for specific sensor identification, the overall process was designed to be user-friendly for anyone with a basic understanding of Windows software installation.
System Requirements and Compatibility: A Look at Its Operating Environment
MotherBoard Monitor was primarily developed for the Windows ecosystem, demonstrating impressive backward compatibility for its time. Its official system requirements targeted “Windows 95 and prior versions,” explicitly mentioning “Windows NT” in its app specifications. This meant that a broad spectrum of users, from those running older hardware to those on more stable professional platforms, could utilize the software.
- Operating Systems: Windows 95, Windows 98, Windows Me, Windows NT, Windows 2000, and likely Windows XP (though not explicitly listed as “prior versions” in some contexts, it generally functioned). This wide range of support made it a versatile tool during the transition phases of Microsoft’s operating systems.
- Platform: Windows PC.
- Language: Primarily English. While download options for other languages existed, the core application and its detailed documentation were in English.
- Version: The most commonly cited version, 5.3.7.0, was updated in late 2004, indicating its active development ceased around that period, though later updates for the PhanMemFree page itself might show a 2022 date, referring to the catalog entry update, not the software itself.
- Size: It was remarkably lightweight, with a file size of just 1.28 MB (as per later specifications), reinforcing its minimal impact on system resources and making it easy to download even on slower internet connections of the past.
The focus on these older operating systems highlights MBM’s role as a tool for a specific computing era. While modern systems have different monitoring needs and more integrated solutions, MBM provided essential functionality for the hardware and software environments it was designed for, allowing users to extend the life and optimize the performance of their machines during a crucial period of PC evolution.
The Enduring Value of Real-time Monitoring for PC Health
Even as we navigate an age of cloud computing, advanced diagnostics, and self-optimizing hardware, the core tenets championed by MotherBoard Monitor remain profoundly relevant. The value of real-time monitoring for PC health has not diminished; if anything, it has become even more critical given the increasing complexity and performance demands placed on modern systems.
Today’s high-performance CPUs and GPUs generate significant heat, and even minor cooling inefficiencies can lead to throttling, reduced lifespan, or outright failure. Modern power supplies must deliver stable and precise voltages to an array of components, and fluctuations can cause instabilities that are hard to diagnose. The principles that MotherBoard Monitor introduced—the ability to keep an eye on temperatures, voltages, and fan speeds—are still foundational to maintaining a healthy and stable computer.
While contemporary tools offer more sensors, richer data visualization, and advanced AI-driven diagnostics, they all build upon the legacy of pioneering software like MBM. It instilled in a generation of PC users the importance of understanding their hardware, proactively identifying potential issues, and taking steps to mitigate them. Whether you’re an extreme overclocker pushing limits, a professional needing maximum uptime, or a casual user wanting to ensure your machine runs smoothly, the basic act of “monitoring your motherboard” remains an essential habit. MotherBoard Monitor, through its accessibility and powerful feature set, laid the groundwork for this essential aspect of PC stewardship, reminding us that even in the most advanced digital environments, a keen eye on the physical health of our machines is paramount.
File Information
- License: “Free”
- Version: “5.3.7.0”
- Latest update: “January 6, 2022”
- Platform: “Windows”
- OS: “Windows NT”
- Language: “English”
- Downloads: “81.2K”
- Size: “1.28 MB”


