
R-Project, a powerful and versatile open-source software environment, has become indispensable for statistical computing, data analysis, and graphical representation. Developed as a GNU project, it’s an implementation of the S programming language, originating from Bell Laboratories. While sharing much of S’s functionality, R has evolved into a robust and extensively used tool within various scientific and data-driven fields. This guide delves into the core features, applications, and advantages of R-Project, comparing it to similar software and exploring its vast ecosystem of extensions and interfaces.
Understanding R-Project: More Than Just a Statistical Package
R is fundamentally a programming language, distinguished by its focus on statistical analysis and data visualization. Its strength lies in its capacity to handle complex statistical computations, generate high-quality graphics, and manage large datasets with ease. Unlike simpler point-and-click statistical software, R offers a high degree of flexibility and control, enabling users to customize their analyses and create tailored solutions to their specific research questions.
This power stems from its open-source nature and active community. The core language is continuously updated and refined, incorporating advancements in statistical methodology and computing techniques. This collaborative environment fosters the development of numerous extension packages—specialized libraries offering functions for niche applications. These packages extend R’s capabilities, providing ready-made tools for various domains, from bioinformatics and econometrics to machine learning and text analysis.
The open-source aspect also means R is freely available for use, modification, and distribution, making it accessible to a wide range of researchers, students, and practitioners. This removes the financial barriers often associated with proprietary software, facilitating wider adoption and collaboration across the scientific community.
Key Features and Capabilities of R-Project
The versatility and effectiveness of R-Project are rooted in several key features:
-
Open-Source and Collaborative: As a GNU project, R benefits from a vast, globally dispersed community of developers and users who constantly contribute to its improvement, expanding its functionalities and resolving issues promptly. This collaborative spirit is reflected in the extensive documentation, readily available online tutorials, and the abundance of support forums.
-
Multilingual and Extensible: R’s core is written in a combination of C, Fortran, and its own language, allowing for efficient integration with other software and libraries. Furthermore, the extensive package system provides access to a wealth of specialized functions and tools. Need to perform spatial analysis? There’s a package for that. Want to build machine learning models? There are multiple packages designed specifically for this purpose. This extensibility ensures R remains relevant and adaptable to ever-evolving analytical needs.
-
Command-Line Interface and Integrated Development Environments (IDEs): While R can be used interactively through a command-line interface, its true potential is often realized through the use of IDEs like RStudio. These user-friendly interfaces offer features like code completion, debugging tools, and project management capabilities, simplifying the coding process and improving overall productivity. RStudio, in particular, has become the de-facto standard IDE for R, enhancing its usability and accessibility, even for users without extensive programming experience.
-
Cross-Platform Compatibility: R runs seamlessly across various operating systems, including Windows, macOS, and Linux. This cross-platform compatibility eliminates the need for platform-specific versions, promoting broader accessibility and simplifying data sharing among users on different systems. The consistency across platforms ensures code written on one operating system will execute identically on others, streamlining collaborative projects and data analysis workflows.
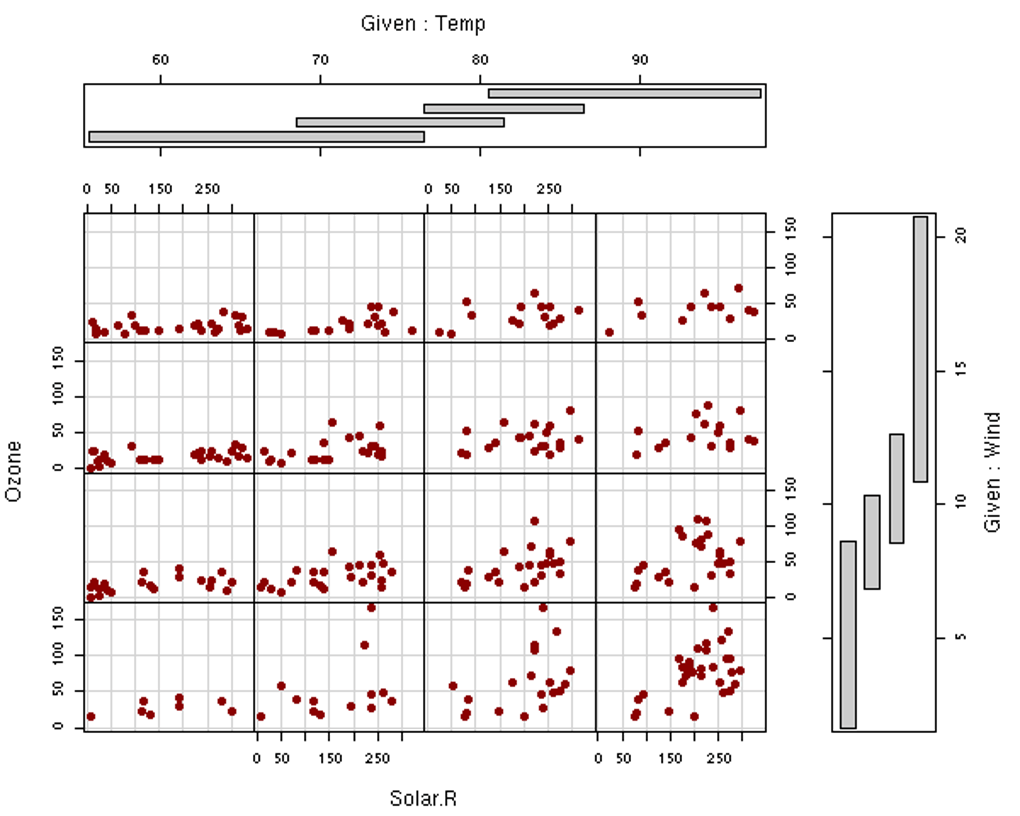
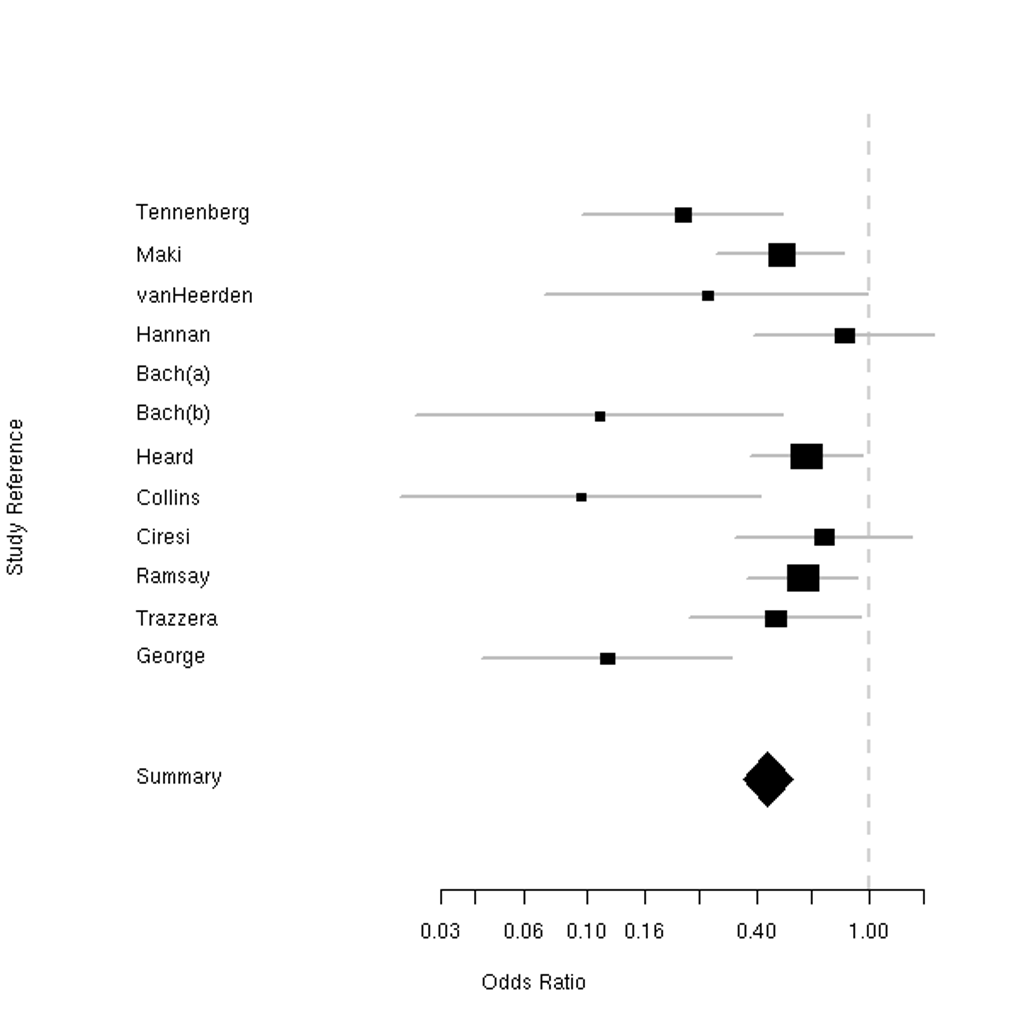
- Powerful Graphics Capabilities: R offers extensive capabilities for creating static and interactive graphics, making it invaluable for data visualization. Users can generate a variety of plots, charts, and other visual representations of their data, facilitating clearer communication of findings and insights. This allows for effective visual exploration and communication of statistical results, providing more than just numerical outputs.
R-Project vs. RStudio: A Symbiotic Relationship
It’s crucial to understand the distinction between R and RStudio. R itself is the core statistical computing language and environment. RStudio is an IDE—a graphical user interface designed to facilitate interaction with R. While R handles the underlying computations, RStudio enhances the user experience, providing tools for improved code management, debugging, and visualization.
R, running in the background, performs the statistical analyses and calculations. RStudio provides a user-friendly environment for writing, executing, and managing the R code. Think of it as a powerful engine (R) combined with a well-designed control panel (RStudio) to make the entire process more efficient and user-friendly. RStudio’s features such as syntax highlighting, code completion, and integrated help significantly reduce errors and enhance productivity for users of all experience levels. The combination delivers a streamlined workflow, improving both the ease of use and the efficiency of R.
Why Choose an R Project? Organization and Reproducibility
Organizing data analysis projects is critical for maintaining clarity and ensuring reproducibility. An R project, implemented through the use of RStudio’s project functionality, provides a structured framework for organizing all aspects of a project into a single, self-contained directory. This includes code files (.R scripts), data files (.csv, .txt, etc.), and any generated output (plots, tables, reports).
The centralized project directory simplifies project management, especially for complex analyses involving numerous files and scripts. This organization also enhances collaboration, as all project components are readily accessible to team members, ensuring consistency and facilitating efficient sharing of work. The ability to maintain a complete and organized record of the analysis process also improves the reproducibility of research findings.
Who Uses R-Project? A Diverse Community of Users
R’s versatility appeals to a broad spectrum of users, making it a valuable tool across various disciplines. Some key user groups include:
- Statisticians: R’s extensive statistical functions and libraries make it an ideal choice for statisticians needing to perform complex analyses and develop novel statistical methods. The flexibility and power of R allow statisticians to tailor their analyses to specific research questions and handle complex datasets efficiently.
-
Data Miners: The ability to process and analyze large datasets efficiently, coupled with R’s diverse packages for data manipulation and pattern recognition, positions it as a preferred tool for data miners. The open-source nature and extensive community support further strengthen its utility for this group.
-
Data Scientists: R’s breadth of capabilities, encompassing data cleaning, transformation, modeling, and visualization, makes it a crucial tool in the data scientist’s arsenal. Its ability to handle various data types, from numerical and categorical to textual data, provides a comprehensive platform for data-driven insights.
-
Bioinformaticians: In bioinformatics, R is extensively used for analyzing genomic data, performing statistical analyses of biological experiments, and developing new methods for interpreting complex biological data. Specialized packages in bioinformatics significantly enhance R’s capabilities in this field.
-
Economists and Financial Analysts: R is increasingly used for econometric modeling, financial forecasting, and risk management due to its capabilities in handling time-series data and econometric analyses. The availability of specialized packages related to econometrics and finance strengthens its usefulness in this domain.
Advantages and Disadvantages of R-Project
As with any software, R-Project has both advantages and disadvantages:
Advantages:
- Powerful and versatile: Handles complex calculations and statistical analyses with ease.
- Open-source and free: Accessible to everyone, promoting wider adoption and community contributions.
- Extensive libraries and packages: Offers a vast ecosystem of specialized tools for diverse applications.
- Cross-platform compatibility: Runs consistently across different operating systems.
- Strong visualization capabilities: Enables the creation of high-quality static and interactive graphics.
- Active community and extensive documentation: Provides ample support and resources for users of all skill levels.
Disadvantages:
- Steeper learning curve: Compared to point-and-click software, R requires some programming knowledge.
- Can be challenging for beginners: The initial learning curve can be daunting for users without prior programming experience.
- Error messages can be cryptic: Debugging can sometimes be difficult due to the nature of the programming language.
Alternatives to R-Project
Several alternative software packages offer similar functionalities to R-Project, each with its own strengths and weaknesses:
-
Minitab: A commercial statistical software package known for its user-friendly interface and ease of use. While less powerful than R, it’s well-suited for users without programming experience.
-
Stata: A commercial statistical software package often used in econometrics and social sciences. Stata offers a more streamlined interface compared to R but is less flexible in terms of customization.
-
Octave: A free and open-source numerical computation environment similar to MATLAB. While not as focused on statistical analysis as R, Octave’s strengths lie in numerical computation and simulation.
-
SPSS: A commercial statistical software package popular in social sciences and market research. SPSS provides a user-friendly interface but lacks the flexibility and extensibility of R.
The choice between R and these alternatives depends on the specific needs of the user and their level of programming expertise. R’s power and flexibility often outweigh its steeper learning curve for users needing advanced statistical analysis capabilities and customization. However, for users requiring a simpler interface and less coding, alternatives like Minitab or SPSS may be more suitable.
In conclusion, R-Project stands as a leading tool for statistical computing and data visualization, its strengths rooted in its open-source nature, powerful capabilities, and vibrant community. While possessing a learning curve, its versatility, extensibility, and immense capacity for handling complex datasets make it an invaluable resource for researchers, data scientists, and anyone working with data-intensive projects. The symbiotic relationship with RStudio further simplifies its use, making it accessible to a broader user base and solidifying its place as a critical tool in the modern data science landscape.
File Information
- License: “Free”
- Version: “2.8.1”
- Latest update: “December 19, 2023”
- Platform: “Windows”
- OS: “Windows XP”
- Language: “English”
- Downloads: “42.9K”
- Size: “30.75 MB”


