
SigmaPlot is a widely recognized and powerful software package designed for advanced data analysis and the creation of high-quality scientific graphs. Its capabilities extend far beyond simple spreadsheet manipulation, offering a robust suite of tools for complex statistical analysis and visually compelling data representation. This comprehensive guide delves into the features, functionalities, and applications of SigmaPlot, exploring its strengths and limitations to provide a thorough understanding of this versatile software.
Powerful Graphing Capabilities: Visualizing Data with Precision
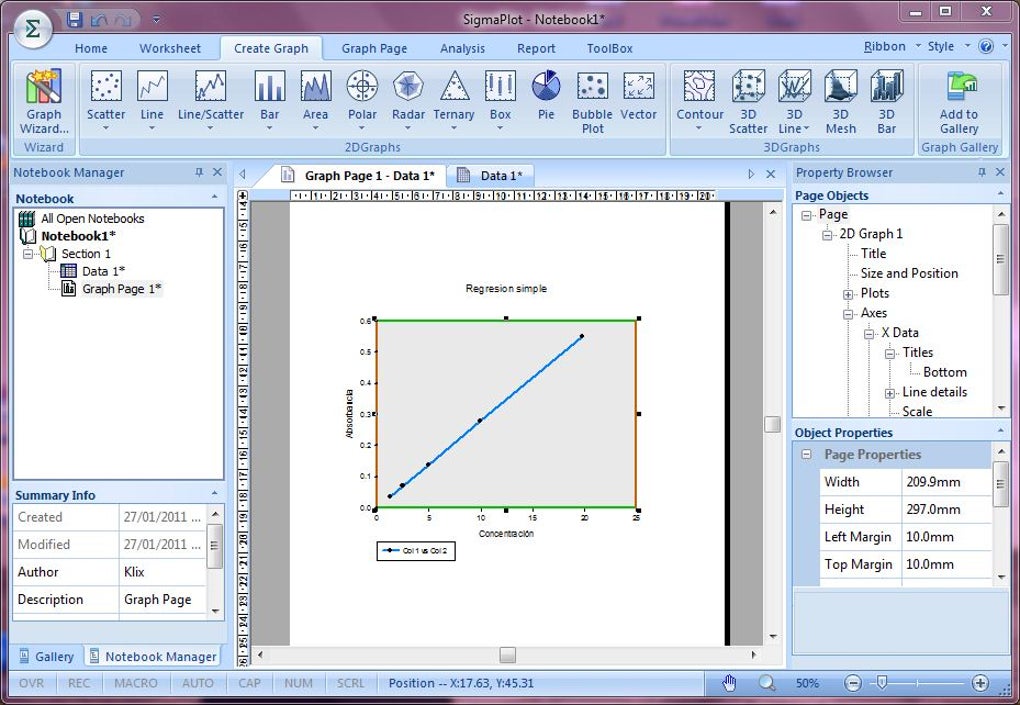
SigmaPlot’s core strength lies in its exceptional graphing capabilities. The software boasts over 100 different types of 2D and 3D graphs, providing researchers and scientists with a vast array of options to visualize their data effectively. This extensive library allows users to choose the most appropriate graph type for their specific data and research needs, ensuring clear and accurate representation. Beyond the sheer number of graph types, SigmaPlot excels in its customization options. Users can fine-tune every aspect of their graphs, from adjusting axis labels and scales to modifying colors, fonts, and legends. This level of control enables the creation of publication-ready graphs that meet the highest standards of scientific rigor. The software’s ability to export graphs in various formats, including high-resolution images and vector graphics, further enhances its versatility, making it ideal for presentations, publications, and reports. The ease with which users can create and customize complex visualizations makes SigmaPlot an indispensable tool for anyone needing to effectively communicate data-driven insights.
Advanced Statistical Analysis: Beyond Basic Calculations
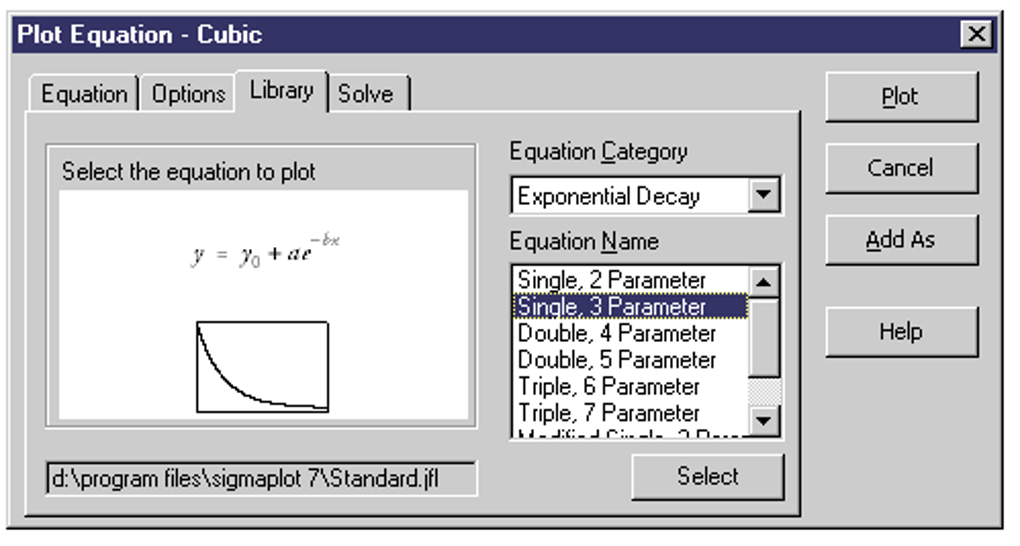
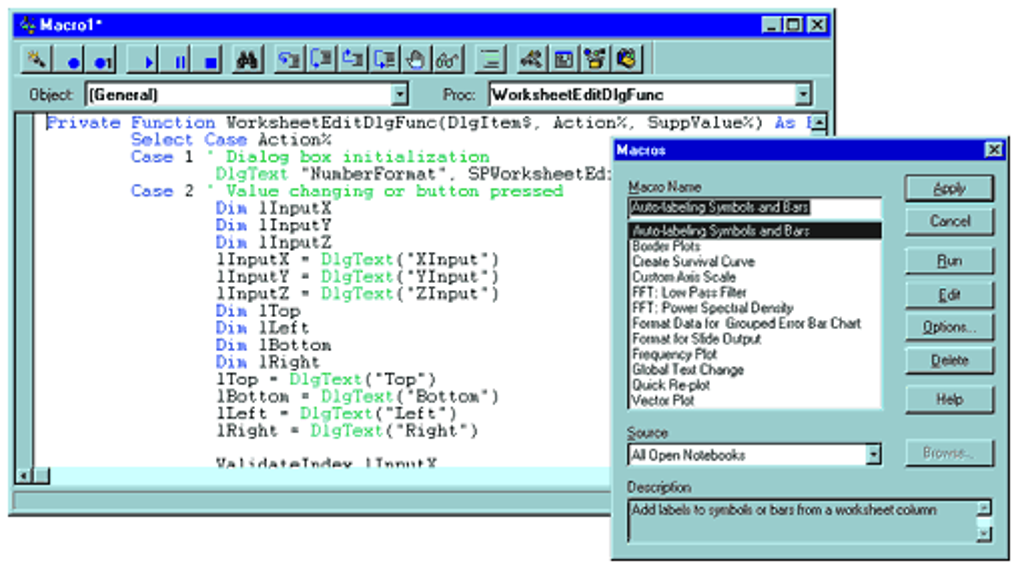
SigmaPlot’s functionalities extend far beyond simple graphing; it’s a powerful tool for complex statistical analysis. With over 50 built-in statistical tests, it provides a comprehensive toolkit for researchers across various scientific disciplines. These tests cover a wide spectrum of analytical needs, ranging from basic descriptive statistics to sophisticated multivariate analyses. The software’s intuitive interface guides users through the process of selecting appropriate tests and interpreting results. Step-by-step wizards simplify complex procedures, making advanced statistical analysis accessible to users with varying levels of statistical expertise. This accessibility is crucial, as it allows researchers to focus on their data and interpretations rather than getting bogged down in technical complexities. For users comfortable with programming, SigmaPlot also offers the ability to leverage Visual Basic macros for greater control and customization of the analytical process. This feature allows for the automation of repetitive tasks and the development of custom statistical procedures tailored to specific research requirements.
Seamless Integration: Working with Other Software Applications
SigmaPlot’s design emphasizes seamless integration with other widely used software applications, particularly within the Microsoft Office suite. Its compatibility with Excel allows for straightforward import and export of data, simplifying the workflow for researchers who regularly use spreadsheets for data management. This integration enables users to seamlessly transition between data analysis in SigmaPlot and data organization and manipulation in Excel. The ability to directly import data from Excel files eliminates the need for cumbersome data reformatting, saving valuable time and reducing the potential for errors. Furthermore, SigmaPlot’s ability to export results as PowerPoint presentations streamlines the process of creating visually engaging presentations and reports. This feature is especially valuable for researchers who need to present their findings effectively to a broader audience. This seamless integration with established software platforms is a key advantage, fostering efficiency and enhancing the overall research process.
User-Friendliness and Accessibility: Catering to Diverse Skill Levels
While SigmaPlot handles complex statistical analyses and sophisticated visualizations, it is designed with user-friendliness in mind. The software incorporates several features to cater to users with varying levels of expertise. Step-by-step wizards guide novice users through complex procedures, minimizing the learning curve and ensuring that even those new to data analysis can effectively utilize the software’s full potential. The intuitive interface is designed for ease of navigation, allowing users to quickly locate the tools and features they need. However, SigmaPlot also caters to experienced users who prefer greater control. The option to use Visual Basic macros provides advanced users with the flexibility to customize and automate their workflows, creating tailored solutions for specific research needs. This dual approach, combining user-friendly interfaces with advanced customization options, makes SigmaPlot accessible and powerful for researchers at all skill levels. Comprehensive online help resources further enhance the user experience, providing assistance and guidance when needed.
Limitations and Alternatives
While SigmaPlot is a powerful and versatile tool, it’s important to acknowledge its limitations and consider alternative software packages depending on specific needs and preferences. One potential limitation is the cost; SigmaPlot is a commercial software, and the licensing fee may be a barrier for some users or institutions. The software’s extensive feature set might be overwhelming for users who only need basic graphing and statistical capabilities. In these cases, free and open-source alternatives like R or Python with suitable packages might be more appropriate. Other commercial alternatives such as Minitab or JMP offer comparable functionalities, each with its own strengths and weaknesses regarding specific statistical techniques, user interfaces, and integration with other software. Ultimately, the choice of software depends on individual requirements, budget, and familiarity with different platforms. Evaluating these factors carefully is essential for selecting the most suitable tool for your specific data analysis needs.
Conclusion: A Powerful Tool for Scientific Research
SigmaPlot stands as a highly effective and comprehensive solution for advanced data analysis and scientific graphing. Its combination of a wide array of graph types, sophisticated statistical functions, seamless integration with other software, and user-friendly interface makes it a valuable tool for researchers and scientists across a broad spectrum of disciplines. While its cost and comprehensive features may not be suitable for all users, for those requiring powerful analytical and visualization capabilities, SigmaPlot offers an exceptional solution that streamlines the research process and enables the effective communication of scientific findings. The balance between user-friendliness and advanced functionality makes it a compelling option for both novice and experienced users, empowering them to delve deeper into their data and translate their findings into clear and impactful visualizations. The continued development and improvement of SigmaPlot suggest it will remain a critical tool in the scientific landscape for years to come.
File Information
- License: “Trial version”
- Version: “13”
- Latest update: “February 12, 2019”
- Platform: “Windows”
- OS: “Windows 8”
- Language: “English”
- Downloads: “132.9K”
- Size: “78.38 MB”


