
Gnuplot stands as a testament to enduring utility in the digital age, a powerful and versatile command-line driven utility designed for plotting mathematical functions and data. Since its inception in 1986, it has grown from a specialized tool for scientists and students into a ubiquitous engine for visualization, deeply embedded in everything from academic research to web scripting and third-party application integration. It is not merely a software application; it is a fundamental component in the toolkit of anyone who needs to graphically represent complex datasets or intricate mathematical expressions across an astonishing array of platforms.
Initially conceived to offer a straightforward yet robust method for visualizing quantitative information, Gnuplot has maintained its core philosophy of being freely distributed and highly portable. This commitment to accessibility and versatility has cemented its place as a go-to solution for generating high-quality 2D and 3D plots. Whether you’re a physicist analyzing experimental results, a student grappling with calculus, a developer integrating plotting capabilities into a web service, or an IT professional monitoring system performance, Gnuplot provides the means to transform raw numbers into insightful graphical representations. Its longevity and continuous development, spanning more than three decades, underscore its adaptability and its indispensable role in the ever-evolving landscape of data analysis and visualization. The software, available for platforms ranging from UNIX, IBM OS/2, MS Windows, DOS, Macintosh, and VMS to Atari and many others, truly lives up to its claim of exceptional portability, ensuring its availability wherever computation happens.
A Pillar of Productivity in Data Visualization
In today’s data-rich environment, the ability to quickly and accurately visualize information is paramount to productivity. Gnuplot excels in this regard, serving as a powerful engine that significantly enhances efficiency for individuals and organizations alike. Its command-line interface, often perceived as a barrier by newcomers, is precisely what makes it an unparalleled tool for automating visualization tasks, enabling users to define complex plots through scripts that can be reused and modified with ease.
The true power of Gnuplot as a productivity enhancer lies in its scripting capabilities. Instead of manually clicking through menus and options, users can write simple text files containing Gnuplot commands. These scripts can generate dozens, hundreds, or even thousands of plots from various data sources without any manual intervention. For researchers conducting extensive simulations, engineers analyzing iterative design changes, or analysts processing daily logs, this automation translates into immense time savings. Imagine having to generate 50 different plots for a report; with Gnuplot, a single script can accomplish this task in seconds, where manual execution might take hours. This level of automation not only saves time but also ensures consistency across all visualizations, reducing the potential for human error.
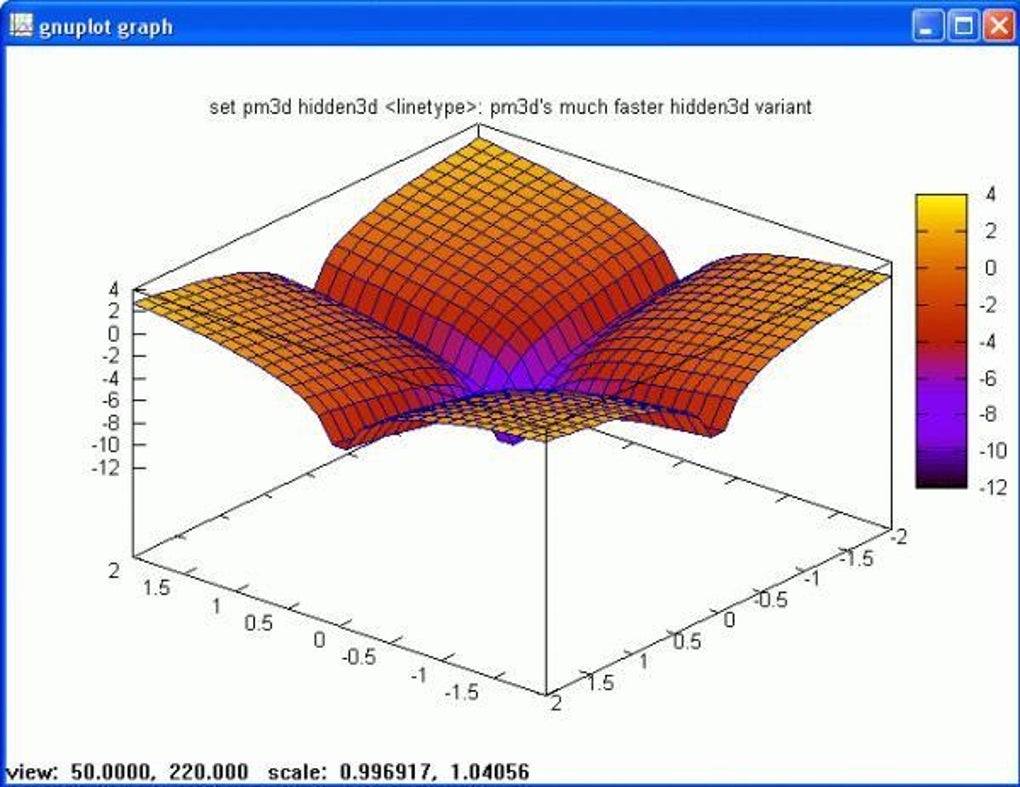
Furthermore, Gnuplot’s ability to handle diverse data types and plot styles directly contributes to productivity. It supports a wide array of plotting methods, including lines, points, boxes, contours, vector fields, and surfaces, alongside specialized plot types. This comprehensive suite means that users rarely need to switch between different visualization tools for different tasks. A single Gnuplot script can be adapted to represent various facets of a dataset, from a simple scatter plot to a sophisticated 3D surface, all within the same environment and using a consistent syntax. This unified approach streamlines the workflow, minimizes context switching, and allows users to focus on data interpretation rather than tool management.
The integration capabilities of Gnuplot further amplify its productivity benefits. As a robust plotting engine, it can be seamlessly incorporated into other applications and scripting languages. For instance, developers often use Gnuplot as a backend for plotting in programs written in Python, Perl, C, or Java. This means that custom applications can leverage Gnuplot’s powerful visualization features without needing to reimplement them. In web development, Gnuplot can generate dynamic plots on the fly, transforming raw data into visual charts for dashboards or reports directly on web pages. This “headless” operation — where Gnuplot runs in the background to produce output files without an interactive display — is a cornerstone of modern data-driven web applications and automated reporting systems. By acting as a dependable backend, Gnuplot enables developers to create highly functional and visually rich applications with increased efficiency, proving its value as a core component in the broader software ecosystem.
An Indispensable Utility and Tool for Analysis
Gnuplot is fundamentally a utility and tool, meticulously designed to perform the specific task of data and function plotting with exceptional precision and adaptability. Its strength lies not just in its longevity but in its continually refined feature set, making it an indispensable asset for anyone engaged in quantitative analysis. As a standalone utility, it provides a direct interface for users to interact with their data, offering granular control over every aspect of a plot.
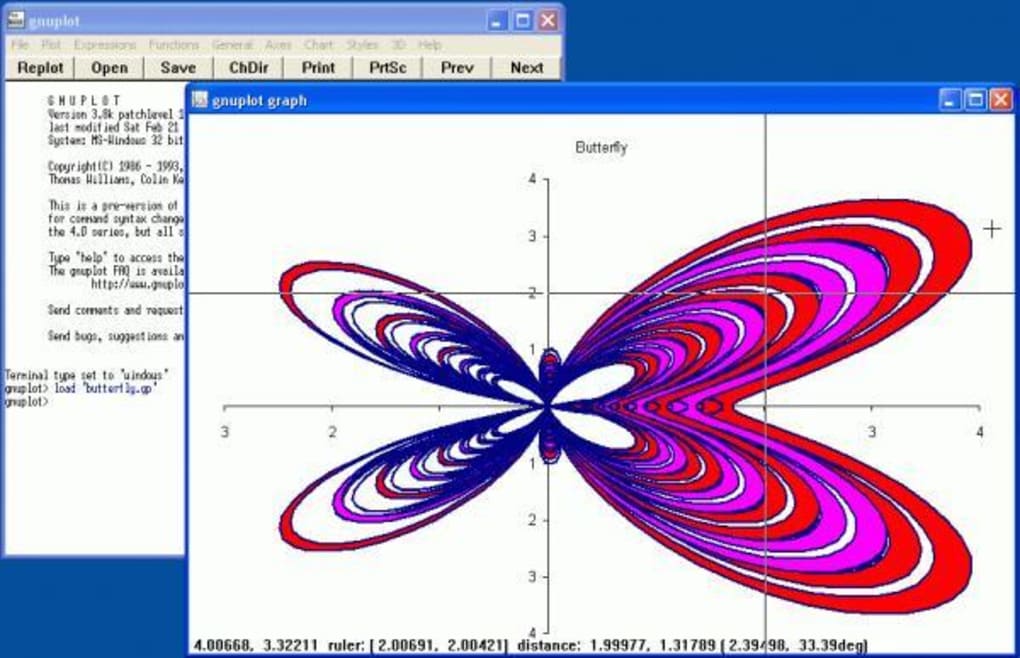
The core utility of Gnuplot stems from its expansive support for a multitude of plot types, catering to nearly any visualization need in 2D and 3D. For two-dimensional data, users can create line plots, scatter plots using points or various symbols, bar charts with boxes, and error bar plots, among others. When delving into three-dimensional data, Gnuplot shines with its ability to generate contour plots, vector fields, and intricate surface plots. This versatility ensures that regardless of the nature of the data – be it time series, frequency distributions, spatial data, or complex mathematical functions – Gnuplot offers an appropriate and visually effective method for representation. Its command syntax is intuitive for those accustomed to mathematical notation, allowing for the direct plotting of functions without requiring prior data files, which is particularly useful for students and educators illustrating concepts.
Beyond merely drawing, Gnuplot offers a high degree of customization for each plot element. Users can precisely control line styles, point types, colors, fonts, axis labels, titles, legends, and virtually every graphical attribute. This level of detail is crucial for scientific publications, presentations, and any context where clarity and aesthetic quality are paramount. The ability to fine-tune plots ensures that the generated visualizations are not just accurate but also convey information effectively and professionally. The extensive documentation and active community around Gnuplot provide ample resources for users to master these customization options, transforming raw plots into polished, publication-ready figures.
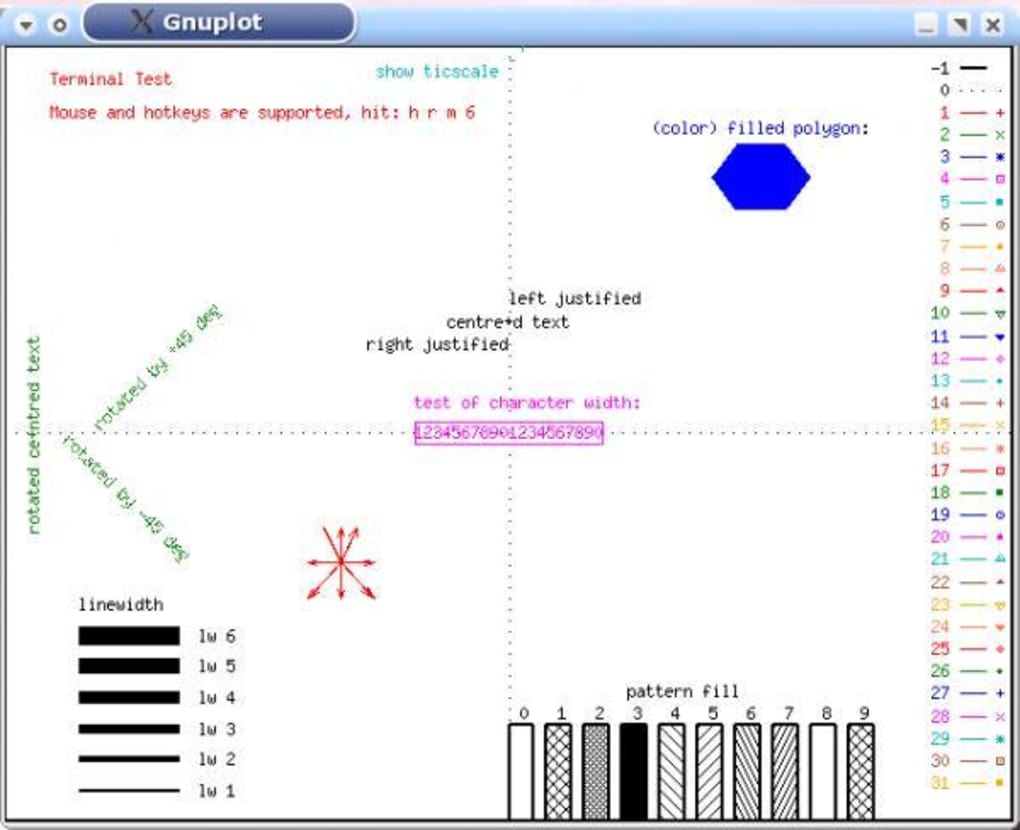
Perhaps one of Gnuplot’s most significant strengths as a utility is its terminal versatility. A “terminal” in Gnuplot refers to the output device or format. Gnuplot supports an extraordinary range of terminals, ensuring that plots can be rendered virtually anywhere and in any desired format. These include:
- Interactive Screen Terminals: For immediate visualization and exploration, Gnuplot offers interactive terminals with mouse and hotkey functionality, allowing users to zoom, pan, rotate 3D plots, and query data points directly. This is invaluable for exploratory data analysis.
- Vectorial Pseudo-Devices: For high-quality, scalable output perfect for printing and professional documents, Gnuplot supports formats like Postscript (PS, EPS), LaTeX, Metafont, PDF, and SVG (Scalable Vector Graphics). These formats ensure that plots retain their crispness and clarity at any resolution.
- Bitmap Formats: For web integration or contexts where image size is a concern, Gnuplot can output to common bitmap formats such as PNG (Portable Network Graphics) and JPEG.
- Printers and Plotters: Gnuplot can directly send output to various printers (including many color devices) and pen plotters (like HPGL devices), maintaining its historical roots in hardware output.
This extensive terminal support means that a single Gnuplot script can be used to generate output for a scientific paper (using LaTeX/PDF), a web dashboard (using PNG/SVG), and an interactive session (using a screen terminal), simply by changing one command. Moreover, Gnuplot is easily extensible, allowing developers to add support for new devices or custom output formats as needed. This adaptability ensures Gnuplot remains relevant and powerful in a rapidly evolving technological landscape, solidifying its status as an indispensable utility for data analysis and visualization.
Empowering Development and IT Professionals
For development and IT professionals, Gnuplot is far more than just a plotting tool; it is a flexible and robust component that can be integrated into various workflows, enhancing system monitoring, data analysis, and application development. Its command-line nature and scriptability make it a natural fit for automated processes and programmatic control, aligning perfectly with the principles of efficient software engineering and IT operations.
One of the most significant applications of Gnuplot in the development and IT sphere is its role in web scripting. Modern web applications often require dynamic visualization of data, whether it’s user statistics, financial trends, or real-time sensor readings. Gnuplot can be invoked from server-side scripts (e.g., in PHP, Python, Ruby, Node.js) to generate plot images on the fly. A web server can collect data, pass it to a Gnuplot script, and then serve the generated PNG or SVG image directly to the client’s browser. This capability allows developers to create interactive and data-driven web experiences without the overhead of client-side plotting libraries for every scenario, especially when computational resources are better managed on the server. The lean footprint and high performance of Gnuplot make it an ideal choice for such server-side rendering tasks, ensuring quick response times and efficient resource utilization.
Furthermore, Gnuplot functions as a powerful plotting engine for a wide array of third-party applications. A prime example is its integration with Octave, a high-level language primarily intended for numerical computations, which is largely compatible with MATLAB. Octave, and similar scientific computing environments, often rely on external tools for sophisticated plotting. Gnuplot serves this role admirably, allowing users of these numerical analysis tools to leverage its extensive plotting capabilities through simple function calls within their respective environments. This integration extends to other programming languages as well. Developers building data analysis tools in Python, Java, C++, or Perl can easily call Gnuplot from their code to render complex plots, passing data and commands programmatically. This approach allows developers to focus on the computational logic of their applications while offloading the complexities of graphical rendering to a highly optimized and specialized tool like Gnuplot.
In IT operations, Gnuplot is an invaluable asset for system administrators and network engineers. It can be used to visualize performance metrics such as CPU usage, memory consumption, disk I/O, and network traffic over time. By piping output from system monitoring tools directly into Gnuplot scripts, administrators can generate real-time graphs that help identify bottlenecks, predict failures, and understand system behavior. This proactive visualization aids in maintaining system health, optimizing resource allocation, and troubleshooting issues more effectively. The ability to quickly generate customizable graphs from logs and monitoring data provides critical insights that would be difficult to discern from raw text output alone, making Gnuplot an essential analytical tool for robust IT infrastructure management. Its free and open-source nature also aligns well with the typical toolchain in many development and IT environments, promoting flexibility and cost-effectiveness.
A Foundation for Education and Reference
Gnuplot’s role extends profoundly into the realms of education and reference, having served for decades as a foundational tool for teaching, learning, and conducting scientific research. Its accessibility, comprehensive feature set, and extensive documentation make it an ideal companion for students, educators, and professionals seeking to understand and present mathematical concepts and data.
Historically, Gnuplot was developed with the explicit intention of allowing scientists and students to visualize mathematical functions and data. This original purpose remains a cornerstone of its utility in education today. For mathematics, physics, engineering, and computer science students, Gnuplot provides an immediate and tangible way to see abstract concepts come to life. Plotting a complex function, observing the behavior of differential equations, or visualizing statistical distributions becomes an interactive exercise rather than a purely theoretical one. The command-line interface, while initially daunting, teaches students valuable skills in precision, scripting, and understanding programmatic control over data representation, which are critical in higher education and professional fields. Educators can use Gnuplot to create compelling visual aids for lectures, assignments, and textbooks, enhancing the learning experience and making complex topics more digestible.
Beyond direct instruction, Gnuplot serves as an essential tool for research and academic pursuits. Scientists and researchers across disciplines rely on Gnuplot to analyze experimental data, simulate models, and generate high-quality plots for publications, theses, and conference presentations. Its ability to produce publication-quality graphics in various vectorial formats (like Postscript, PDF, and SVG) is particularly valued in academia, where precise and professional visual communication of results is crucial for peer review and dissemination of knowledge. The consistency and reproducibility offered by Gnuplot scripts mean that figures can be easily updated or regenerated, ensuring accuracy and saving valuable time during the revision process of scientific papers.
As a reference, Gnuplot boasts a wealth of documentation, tutorials, and a vibrant community that has evolved over more than 35 years. The official manual is comprehensive, detailing every command, option, and plot style. Beyond this, countless online tutorials, forums, and examples exist, created by users who have shared their expertise. This rich ecosystem of knowledge serves as an invaluable reference for both new users learning the ropes and experienced users looking for advanced techniques or troubleshooting specific issues. The longevity of Gnuplot means that solutions to common problems are often readily available, and its stable development ensures that these resources remain relevant. This collective body of knowledge reinforces Gnuplot’s position not just as a tool, but as an educational institution in its own right, fostering a culture of learning and knowledge sharing within the scientific and technical communities.
Technical Specifications and Accessibility
Gnuplot’s appeal is also rooted in its practical specifications and broad accessibility. As a free and freely distributed software, it eliminates financial barriers to entry, making it available to anyone with a computer. The current version, 5.4.4, released on May 24, 2023, continues the tradition of regular updates, ensuring compatibility with modern systems and incorporating new features requested by its diverse user base.
The software is remarkably lightweight for its capabilities, with a download size of approximately 38.52 MB for Windows, making it quick to download and install even on systems with limited internet access. Its minimal resource footprint also means it runs efficiently on a wide range of hardware, from older machines to modern workstations. This efficiency is critical for its use in automated scripts and server-side applications where resource consumption must be optimized.
Gnuplot’s cross-platform compatibility is a standout feature. While PhanMemFree.org prominently features “gnuplot for Windows” with over 63.5K downloads last month, highlighting its popularity on this OS (specifically mentioning Windows ME, though it supports all modern Windows versions), its reach extends far beyond. It runs natively on UNIX-like systems, IBM OS/2, MS Windows, DOS, Macintosh, VMS, and even legacy platforms like Atari. This unparalleled portability ensures that users can maintain a consistent visualization workflow regardless of their preferred operating system, fostering seamless collaboration across different computing environments. The availability in English is standard, reflecting its global user base, though the project itself is open-source and benefits from contributions from developers worldwide.
The user reviews, while currently few on PhanMemFree.org, typically reflect appreciation for its power and versatility, often balanced with the recognition that its command-line interface requires a learning curve. However, for those willing to invest a little time, the rewards in terms of control, automation, and high-quality output are immense. Its security status as “Free” and widely distributed reinforces trust in its reliability, having been scrutinized by a vast community over decades.
In conclusion, Gnuplot transcends its simple definition as a plotting utility. It is a cornerstone of productivity, an indispensable analytical tool, a powerful engine for developers, and a fundamental resource for education. Its enduring legacy, marked by continuous development and widespread adoption, underscores its profound impact on how data is visualized and understood across virtually every scientific, engineering, and academic discipline. For anyone seeking precise, customizable, and automated data visualization, Gnuplot remains a premier choice, a testament to the power of open-source software.
File Information
- License: “Free”
- Latest update: “May 24, 2023”
- Platform: “Windows”
- OS: “Windows ME”
- Language: “English”
- Downloads: “63.5K”
- Size: “38.52 MB”


