
WinMTR is an invaluable open-source network diagnostic tool, specifically designed for Windows users. Its user-friendly interface simplifies the often complex process of analyzing network connections, making it accessible even to those without extensive technical expertise. This powerful utility provides a detailed breakdown of network performance, pinpointing potential bottlenecks and problems along the path between your computer and a remote server or website. This in-depth analysis is crucial for troubleshooting a wide range of internet connectivity issues, from slow downloads to intermittent disconnections.
Understanding Network Path Analysis with WinMTR
WinMTR’s primary function is to trace the route data packets take as they travel across the internet. This involves sending multiple ICMP (Internet Control Message Protocol) echo requests (essentially pings) to a specified destination. Unlike the standard tracert or traceroute commands available on other operating systems, WinMTR continuously monitors the response times and loss rates at each hop along the network path. This continuous monitoring provides real-time information on network performance, allowing users to identify fluctuating connection speeds, high latency periods, or specific network devices causing problems.
The results are presented in a clear, tabular format, showcasing each hop (network device) along the path, including its IP address, hostname (if available), and key performance metrics:
-
Loss (%): The percentage of packets lost at each hop. Higher percentages indicate potential problems such as packet filtering, network congestion, or faulty equipment.
-
Average Latency (ms): The average round-trip time in milliseconds for packets to reach the hop and return. Higher latency means slower response times, resulting in sluggish application performance.
-
Best Latency (ms): The shortest round-trip time recorded for a packet to reach the hop and return. This provides a benchmark for optimal performance.
-
Worst Latency (ms): The longest round-trip time recorded. This highlights potential temporary issues or periods of congestion.
This comprehensive data allows users to pinpoint the exact location of network problems. For instance, if a specific hop consistently exhibits high packet loss or latency, it suggests that a problem exists within that portion of the network infrastructure. This could indicate issues with a particular router, internet service provider (ISP) link, or even a congested network segment.
Using WinMTR: A Step-by-Step Guide
Using WinMTR is remarkably straightforward. After downloading and installing the application (which is readily available from reputable sources like the official WinMTR website or trusted software repositories), the process involves these simple steps:
-
Enter the Hostname or IP Address: In the designated field, enter the hostname (e.g.,
www.example.com) or IP address (e.g.,192.168.1.1) of the destination you wish to trace. -
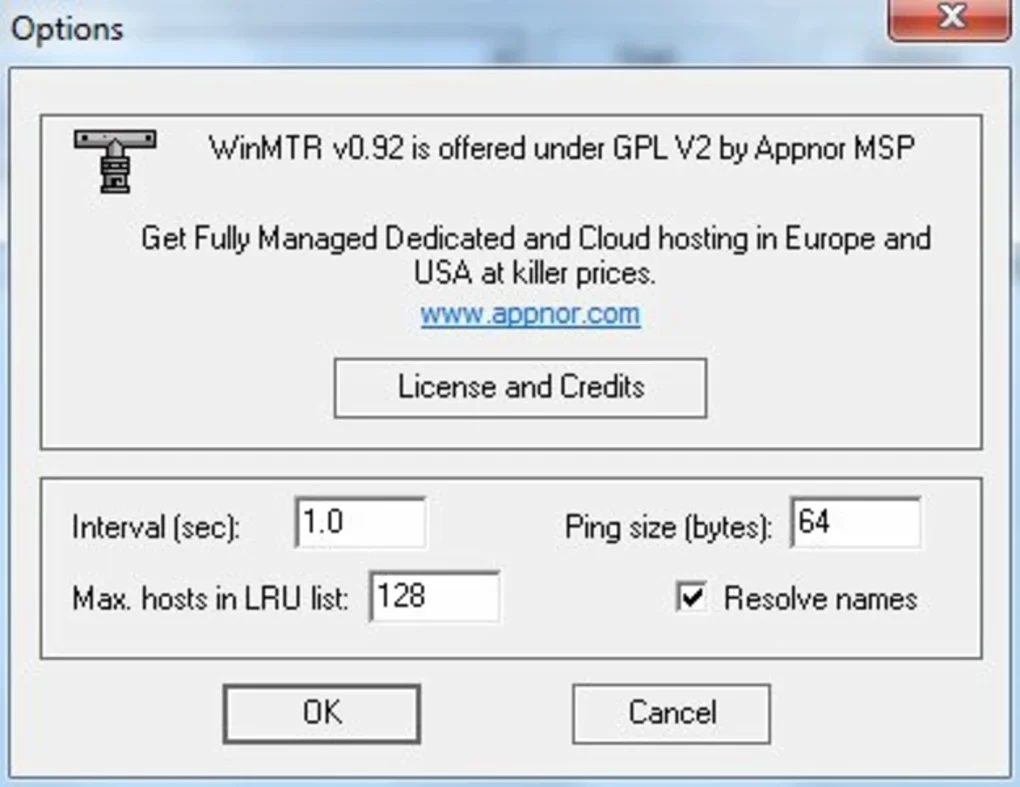
Customize Settings (Optional): WinMTR allows customization of several settings, including the ping size (the number of bytes in each ping packet), the interval between pings, and the number of pings sent before updating the display. For most users, the default settings are sufficient.
-
Start the Trace: Click the “Start” button to begin the trace. WinMTR will immediately commence sending ping packets to the destination and display the results in real-time.
-
Monitor the Results: The main display updates continuously, showing the performance metrics for each hop along the network path. Observe any hops with consistently high latency or packet loss, as these are potential problem areas.
- Export the Results: Once you have gathered sufficient data (typically a few minutes is sufficient for a comprehensive analysis), click the “Stop” button. You can then export the results in either HTML or plain text (.txt) format for later analysis, sharing with technical support, or simply for creating a detailed record of network performance.
Troubleshooting Network Issues with WinMTR Results
The information provided by WinMTR is invaluable for troubleshooting various network-related problems. By analyzing the results, you can identify the source of issues such as:
-
Slow Download Speeds: High latency or packet loss at specific hops can significantly impact download speeds. Identifying these hops helps narrow down the potential causes, such as network congestion or problems with your ISP’s infrastructure.
-
Intermittent Connectivity: Fluctuating latency or packet loss can cause intermittent disconnections or delays. WinMTR helps pin down the unstable segments of the network connection.
-
Game Lag: High latency is a major cause of lag in online games. WinMTR can pinpoint the network bottlenecks affecting game performance, allowing you to identify potential solutions like adjusting network settings or contacting your ISP.
-
Website Unresponsiveness: Slow-loading or unresponsive websites often indicate network problems. WinMTR allows tracing the path to the website’s server, identifying points of congestion or failure.
-
Remote Desktop Connection Problems: Issues connecting to remote desktops can often be attributed to network latency or packet loss. Using WinMTR to analyze the path helps identify the root cause of the connection issues.
By identifying these problem areas, you can take appropriate action, such as contacting your internet service provider, adjusting your router’s settings, or even investigating potential hardware issues within your network.
Beyond Basic Usage: Advanced Features and Applications
While its primary functionality is straightforward, WinMTR offers several features that cater to more advanced users. For example, the ability to customize the ping size allows for more granular analysis of specific network conditions. A larger ping size can sometimes reveal different performance characteristics compared to a smaller size, potentially highlighting issues related to Maximum Transmission Unit (MTU) size or other network layer limitations. The continuous monitoring capability enables observation of dynamic network conditions, such as transient periods of congestion or equipment failures that might be missed by a single trace.
The data provided by WinMTR is not only useful for individual troubleshooting, but it also plays a significant role in professional network diagnostics. Network administrators can leverage WinMTR to pinpoint problems within larger networks, identifying performance bottlenecks and facilitating proactive maintenance. The ability to export results in a readily analyzable format, like HTML or TXT, simplifies the process of sharing data with support teams or collaborators, aiding in collaborative problem-solving. Moreover, the detailed trace information can be invaluable in documenting network issues, aiding in the process of tracking down intermittent problems and resolving recurring connectivity issues.
In conclusion, WinMTR stands as a powerful and versatile network diagnostic tool. Its intuitive interface and comprehensive reporting capabilities make it an indispensable resource for both novice users experiencing simple connectivity problems and network professionals tackling complex network issues. Its open-source nature guarantees continued development and community support, ensuring that it remains a valuable asset for years to come. The combination of ease of use and detailed data analysis makes WinMTR a valuable tool for anyone seeking to understand and improve their network’s performance.
File Information
- License: “Free”
- Version: “0.92”
- Latest update: “May 27, 2024”
- Platform: “Windows”
- OS: “Windows 11”
- Language: “English”
- Downloads: “2.4K”
- Size: “1.91 MB”


